Skip to Main Content Skip to Search
File Exchange
MATLAB Newsgroup
Link Exchange
  Blogs  
 Contest 
MathWorks.com

Inside the MATLAB Desktop

November 1st, 2007

Adding annotations to graphs

Once you’ve analyzed and plotted your data or results, the next step is often to add the plot to a report or a paper as a document. In many cases you will need to add explanation and annotations to the data to explain its salient features to the reader of your document. The Figure Palette (one of the Plot Tools) let’s you do this by adding and configuring annotations such as arrows, text boxes, and shapes directly to the data in your plot.

To get started, plot your data and open the Figure Palette from the Figure View menu.

Open the Figure Palette

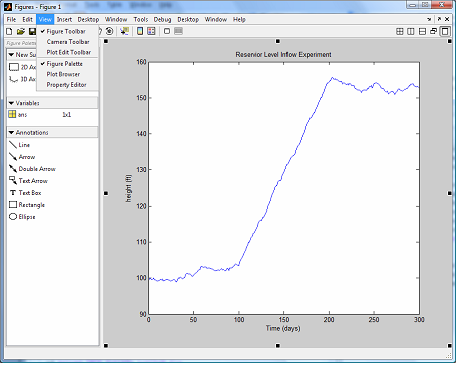
Now, suppose you want to mark the first point of inflection of the plot and add a comment explaining its meaning. Click on the Text Arrow item in the Annotations section of the Figure Palette (shown on the left), then click on the plot to position the base of the arrow and drag & release to position its head. A cursor at the base of the arrow will show you where to enter text.

Adding a Text Arrow

Once the text is entered you can move the arrow and change its orientation by using the positioning handles at the beginning and end of the arrows.

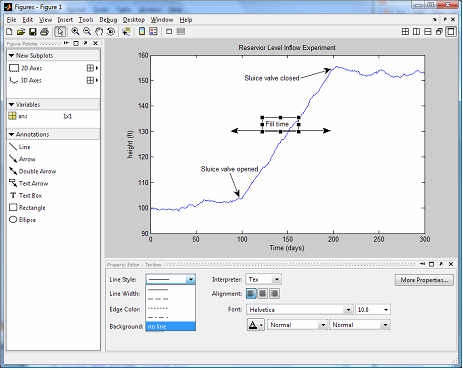
Other arrows and shapes can convey additional information. Suppose you wanted to add a text box explaining the second inflection point and an arrow indicating the time interval between the two inflection points: this could accomplished by copying and pasting the first text arrow and adding a double arrow annotation for time interval. If you wanted to label the double arrow you could use a text box:

Adding a Text Box

By default the text box has a black border. You can remove this by double clicking it to open the Property Editor and setting its Line Style to “none”.

Using the Property Editor to Customize the Text Box

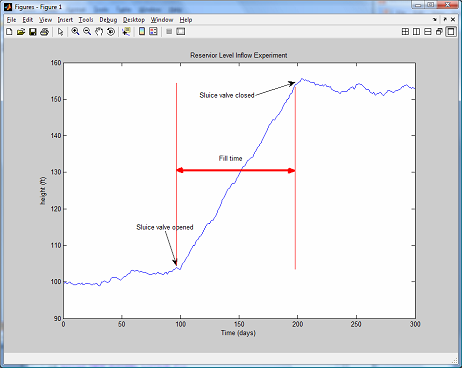
Clicking on the double arrow enables you to modify its color and size properties to get the right look.

Using the Property Editor to Customize the Double Arrow

You can also add lines to draw attention to the left and right extent of the double arrow.
Once you are finished, you can close the Plot Tools and copy the figure to your document.

Completed Figure

The annotations that you have added and edited have treated the figure very much as a document, combining representations of data with conceptual content (the annotations). Consequently, you may want to save your work product as it evolves. This can be done by saving it as a “.fig” file using the figure “File” menu or the MATLAB “hgsave” function. Saved figures can then be restored using the figure “File” menu or the MATLAB command “hgload”.

8 Responses to “Adding annotations to graphs”

  1. hao replied on :

    It will be extremely handy to have a “mouse-over data tip”. Often, it’s too much clutter to display text annotations for each point in a matlab plot. Instead, it would be nice to simply mouse over (or click) on a data point to see its text annotation. What do you think?

  2. Ken replied on :

    Hi Hao,

    You can currently click a point within a figure and see a tool-tip style window containing the selected point. Select the “Data Cursor” tool in the figure window, and subsequently click a point within your figure.

    -Ken

  3. hao replied on :

    Yes, a “tooltip” for data will be nice.

    I see a way of customizing data cursor text.
    http://www.mathworks.com/access/helpdesk/help/techdoc/index.html?/access/helpdesk/help/techdoc/ref/datacursormode.html&http://www.google.com/search?q=data+cursor+matlab&sourceid=navclient-ff&ie=UTF-8&rlz=1B3GGGL_enUS240US240

    but it seems too cumbersome for attaching short descriptions to scatter points in a plot.

    Ideally,

    >> pts = [0.1 0.2; 0.3 0.4; 0.1 0.3];
    >> desc = {’case abc’; ‘case xyz’; ‘case def’};
    >> h = plot(pts(:,1), pts(:,2), ‘o’);
    >> datatooltip (h, desc)

    and you move a mouse over the data point (or click on it) to see the “desc” string. How’s that?

  4. Ken replied on :

    Hi Hao,

    I see what your driving at (I think) - you want to be able to toggle the annotations when you click them (or maybe have them popup when you mouse over them).

    I’ll forward along your request!

    -Ken

  5. Tim replied on :

    I think what Hao is requesting is something just like the ‘TooltipString’ property on uicontrols and the built in tool tips that pop-up when you mouse over the figure toolbar buttons. I’d like to second that request. Is it possible to add a ‘TooltipString’ property to graphics objects such as lines, patches, surfaces, etc.? And maybe even a ‘MouseHoverFcn’ property that defines a function to call when the mouse is hovered over the object. This is just like the existing ButtonDownFcn property but wouldn’t require a mouse click. (The MouseHoverFcn would just allow more end user customization over a simple tooltip display.)

  6. Ken replied on :

    Hi Tim,

    I agree…that sounds like a useful feature. I’ve forwarded your request on to the appropriate team.

    Thanks for the great feedback,
    -Ken

  7. Pat replied on :

    James,
    I like using the annotation, but I often find that when I copy the plot and paste it into a document, the arrows and text have changed location and/or size in the pasted version. Sometime, I manually shift things around to get them to line up in the correct spot, but usually I give up on annotating them in Matlab and wait until I am in Word or PowerPoint to do the annotation. However, I would really like to be able to do the annotation in Matlab since it is much more intuitive.

    How can I get around these resizing and repositioning problems?

  8. Mike replied on :

    Pat,

    Without knowing the details of your issue, I would say go to copy options and try using the “match screen size” and “bitmap” options before copying.

    If that does not help, and you have a license with software maintenance, you should contact technical support (with the same “request a feature” link on the right sidebar) or if not, ping the community on comp.soft-sys.matlab (MATLAB newsgroup link on the top navigation bar).

Leave a Reply


Inside the MATLAB Desktop is written by the MATLAB Interface teams.

Team picture
  • Mike: @Daniel, What are the keyboard shortcuts you use most often? What operations do wish there were shortcuts for?
  • Biswanath Senapati: I am using MATLAB tool for our work. Now I want to integrate matlab desktop (command window) in...
  • Ken: Hi John, I can appreciate your desire for a true Mac user interface. As a Mac user myself, I am constantly...
  • John Haitas: 7 years on… still no native graphics for the Mac. When will Mathworks take time to code a GUI...
  • Ken: Hi Daniel, Your absolutely right - keyboard shortcuts in MATLAB is an area that could use some improvement. Good...
  • Daniel Armyr: Hi. I am one of those old-school people who feels that the command-line has definate merit. However,...
  • Mike: Thanks. Let us know what kinds of things you find most useful.
  • Cnenf: Thank you Michael! MATLAB and this blog has proven itself to be simply invaluable in nearly every project we...
  • Jiro: Yes, if you search the File Exchange, you’ll find SWAP, which was inspired by the file featured here:...
  • Mike: Quan, Excellent suggestion. You probably tried this, but don’t forget about searching the MATLAB File...

These postings are the author's and don't necessarily represent the opinions of The MathWorks.

Related Topics