Ken & Mike on the MATLAB Desktop
November 17th, 2008
Adding Debugging Code Without Changing Your Code
I’d like to welcome guest blogger Ken Atwell from the MATLAB Technical Marketing team. Ken will occasionally be blogging here on the Ken & Mike on the MATLAB Desktop blog.
As helpful as facilities like breakpoints and MATLAB’s interactive environment are, I’m sure that many of us still use “old school” debugging techniques from time to time. Chief among these is scattering disp statements throughout your code and then combing through the output to try to spot where something has gone awry. It is ad hoc for sure, but it gets the job done.
This comes with an obvious downside, though, namely that you will later need to remove all of the debugging code. Not an impossible task, especially if you have a baseline under source control to “diff” against, but it’s an error-prone step nevertheless. One of the more embarrassing moments in my professional career was when I left a debugging statement in the production code. Overnight, the regression test engine unceremoniously barfed on the nightly build and I came into the office the next day to a chorus of jeers. All in good fun and little harm done, but that prompted me to look for alternatives.
Enter the conditional breakpoint, a seemingly unlikely ally. If you have not used conditional breakpoints to date, I encourage you to experiment with them. They are very useful when you need to run through a breakpoint many times before your application gets into (or approaches) an error state.
The trick to using a conditional breakpoint is to simply appreciate that the condition will always be evaluated, but the breakpoint will only be triggered if the condition evaluates to some non-zero value. The condition can be “x>0”, or “min(x{:})>0”, or even … drum roll …“fprintf(‘x is %d\n’, x)”. Basically, it can be any expression that evaluates to some value. Unfortunately, this means we cannot (directly) use disp, since disp does not return a value. That is, you’ll get an error if you try to do something like “y=disp(x)”.
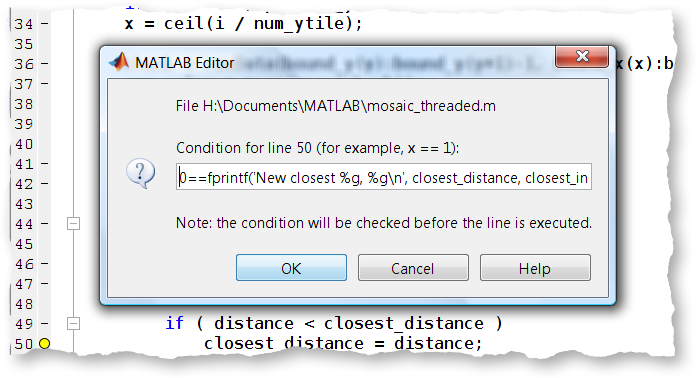
So, let’s try using an “un-conditional” breakpoint to display a string. Set a breakpoint inside your favorite piece of code. Then, right-click that breakpoint and choose “Set/Modify Condition”.
Make the condition “fprintf(‘Hello, World!\n’)”. Now run that code and you’ll see “Hello, World!” written to the Command Window. We did this without modifying the source code itself, so we don’t need to remember to back the change out later. The conditional breakpoint is also shown in yellow in the Desktop, distinguishing it nicely from normal (red) breakpoints.

Right about now you are probably saying, “but my program stopped running at that breakpoint, I wanted my program to continue!” Now we need to concern ourselves with the conditional itself. doc fprintf will remind us that the length of the string is returned. In our case, this was 14 (on my Windows box). This is not zero, so the debugger stopped execution. We need to augment our condition to always evaluate to false. Something like “0==fprintf(‘Hello, World!\n’)” will do the trick. Here, the value returned by fprintf, 14, will be compared against zero (0). The values are not equal, so this expression evaluates to logical false (zero). This means the debugger will continue to run the program.
Make this change to your conditional breakpoint and rerun your program. It still displays the message we inserted, but the program now runs through the breakpoint as desired.
Wait…but what if you are printing something that might actually be of length zero, meaning 0==0, meaning logical true, meaning my program stops-when-I-don’t-want-it-to? Actually, this can’t happen here because the ‘\n’ (newline) guarantees at least one character of output. But, if you don’t have such a guarantee in your fprintf, you can guard against the zero length case with the following funny-looking expression, which always evaluates to false:
0 == fprintf(something) && 0
The “&& 0” performs a logical AND to zero, guaranteeing a false (0) evaluation overall, meaning the debugger will never break at this breakpoint.
Using techniques like this, one can temporarily and non-destructively inject nearly any behavior into their application.
If you’ve ever used conditional breakpoints in an unconventional way, be it in MATLAB or other applications, we’d love to hear about it and learn from your experience and creativity.
-by Ken Atwell, The MathWorks
By
Ken Orr
Ken is a developer on the MATLAB Desktop team. He loves the art of graphic design as well as developing visually pleasing user interfaces - he's one of those 'crazy' Mac guys!
15:35 UTC |
Posted in Debugging, Editor |
Permalink |
You can follow any responses to this entry through the RSS 2.0 feed.
You can skip to the end and leave a response. Pinging is currently not allowed.
Leave a Reply
|
I found a small typo that left me confused for a minute or two. In the paragraph after the second figure I think you had a “false” where it should have said “true”:
…In our case, this was 14 (on my Windows box). This is not zero (false), so the debugger…
^
Should it be true?
As someone who always debugs in the old-school fashion, this article gives me another option to try out.
Thanks,
Ken
Hi Ken,
I removed the “(false)” following the “This is not zero” phrase. The “false” was in reference to “zero”, rather than the “not zero”. This was obviously confusing, and my fault as I added it when editing the article for Ken Atwell.
Thanks for point this out Ken.
-Ken
P.S. If the “(false)” modifier didn’t confuse, people, this comment referencing 3 different Kens’ surely will!
There do seem to be a lot of us Kens converging on this blog. =)
I was also wondering, are conditional breakpoints new as of the most recent releases, or do they go back a ways?
-Ken (Eaton)
Hi Ken,
Conditional breakpoints in the Editor have been around since MATLAB 7 (R14).
-Ken
This is a clever trick!
The breakpoints and the conditions (code) are stored with the Matlab session (R2008a). They are not lost by closing and opening the file, but they are lost by exiting Matlab. Where are they stored? It guess it would be useful to save and load the breakpoints. I realize this is not trivial to make a robust implementation.
With callbacks, events, etc., it is useful to get a list of called functions. I guess it would be useful to automatically set a “breakpoint with output” in the beginning of each function (and method).
dbstatus, dbstop and a little bit of regexp to keep track of the lines might make it possible to implement rough versions of save, load and set breakpoints in the beginning of functions. Have you tried that?
/ per
It is possible to have conditional printouts. Exampel:
function BreakDebugTest
for ii = 1 : 3
z = ii;
end
end
Code of conditioal breakpoint at line 3:
ii==2 && ( 0==fprintf(1,’Conditional: %u\n’, ii ) && false )
Execution BreakDebugTest outputs _one_ line:
Conditional: 2
/per
Per,
To store breakpoints and their conditions, use DBSTATUS and DBSTOP as shown in this documentation example from the reference page for DBSTOP:
http://www.mathworks.com/access/helpdesk/help/techdoc/ref/dbstop.html#bqxd6ek-1
I just did a quick check and this can handle conditional breakpoints as well.
Note that one “gotcha” with breakpoints and conditional breakpoints is that CLEAR ALL will clear them. Most people are a little confused by that behavior the first time they see that. If you want to clear all the variables you have in your workspace without clearing the breakpoints, you can use DBSTATUS before CLEAR, saving the output to a temporary MAT-file, then load the MAT-file and use DBSTOP afterward. Alternately, if you’re using a sufficiently recent version of MATLAB, you can use CLEARVARS.
http://www.mathworks.com/access/helpdesk/help/techdoc/ref/clearvars.html
For the simple case I think You don’t even need the leading “0 == “, but instead can just do:
fprintf(’My message\n’) && 0
it’s a bit tidier.
Per (@5) –
You are correct, breakpoints are lost when you close MATLAB. An option to automatically save state is on our long to-do list. You can save and restore them programmatically using a dbstatus/save/load/dbstop sequence – search the help for “Restore Saved Breakpoints” for details.
If you want to determine if a function was hit during execution or not, using the profiler as a coverage tool is probably the most straight-forward approach. After you’ve run your program with the profiler on, something like this will give you a list of functions called:
I = profile(’info’);
fList = sort({I.FunctionTable(:).FunctionName});
There is also the Coverage Report (“Identifying How Much of an M-File Ran When Profiled” in help), but it is more line-centric than function-centric.
All of that said, you should be able to troll through a file with regexp to pull out the various function declarations and set breakpoints at each, though I have not personally done this.
Per (@6) –
Sure, this should not be a problem. In fact, what you’re describing it closer to the original “intent” of conditional breakpoints. Here is a conditional that prints out even loop iterations for a variable ‘i’:
mod(i,2)==0 && 0==fprintf(’%d\n’, i) && 0
Brenda (@8) –
That is what I thought too, but it didn’t work for me. I found I needed the ‘0==’. I should double-check this with the original developers, but I believe that the conditional *must* evaluate to a logical value. A “bare” FPRINTF returns a scalar, which the debugger complains about at run-time.