Mike on the MATLAB Desktop
November 9th, 2009
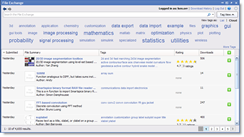
The redesigned Plot Selector in R2009b
The Plot Selector has been redesigned in R2009b! The user interface takes cues from the Function Browser with a search field at the top of the tool and the ability to “tear off” the window to keep it visible. We’ve tried very hard to reuse the same concepts in the user interface when it makes sense (e.g. the search field). This makes it easier for you to apply concepts from one tool in another tool, and keeps the overall look of the product consistent.
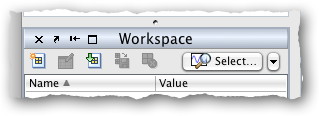
The Plot Selector is available via the button in the Workspace Browser.
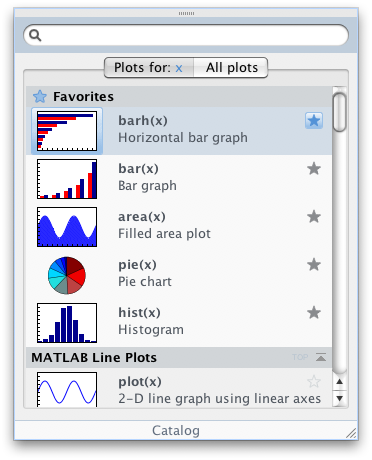
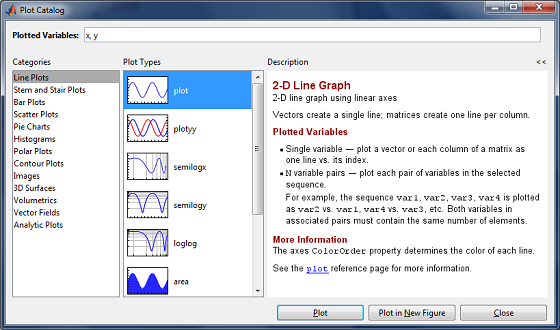
One of our overall goals with user interface design in MATLAB is to help you stay focused on what your doing. To do this, we need to offer you the right information at the right time. In the Plot Selector, this means showing you a graphic of what the plot might look like, as well as more detailed information about the what each plot does. We also show you details about a plot when you hover over it in the Plot Selector, which helps keep you “in flow”:
We also wanted to help streamline your workflow. If there are plots that you frequently use with a particular type of data, you can select the button and promote that plot to the “Favorites” section, which appears at the top of the Plot Selector.
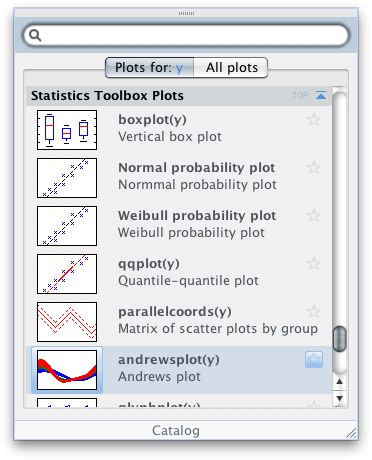
Finally, the Plot Selector now integrates with toolboxes. So if there is a plot that applies to your selected data, it will show up in the Plot Selector. For example, my Plot Selector shows plots from the Statistics Toolbox, because I have that toolbox installed:
We think this redesign will make it easier for you to plot your data and help keep you focused on the task at hand. What do you think?
12:29 UTC |
Posted in Data Tools |
Permalink |
3 Comments »
You can follow any responses to this entry through the RSS 2.0 feed.
You can skip to the end and leave a response. Pinging is currently not allowed.
Leave a Reply
|
This appears to be a useful feature. However, your column would have been better if you had emphasized that users should read the documentation section on “Creating Plots from the Workspace Browser.” Until I read that, I had no idea what this feature was suppose to do just from reading this blog. And, playing with the icon didn’t get me anywhere. I think this is a generational problem I have with stuff you young developers put together.
By the way, the last example in the documentation didn’t work as published: When I dragged the semilogy icon over to the command window, the resulting code wasn’t populated with the published code.
I would be happy to see you illustrate with a detailed workflow example how you expect this “Favorites” feature to be useful. I don’t see it.
Also, you should explain your logic in making the Function Browser & Plot Selector these non-standard types of windows while the Catalog is a standard window.
Since this feature isn’t a function, where is the documentation equivalent to a FRP for it? i.e., where is the single source, comprehensive set of everything I will ever need to use it? The section I found I would describe as an e.g. type of documentation which can be handy to illustrate concepts & to follow as a type of tutorial for getting started. Certainly it succeeded in that purpose.
Since most of my final MatLab work is in the form of .m files, I might find this a handy way to populate prototype code. I suspect I might play with this a bit interactively & then cut & past the generated code from the Command History.
One final point. This feature along with the “improved” Help Navigator appear to have a ton of code running in the background. When I searched for some help on this topic, I searched for Plot Browser & it took ~15 seconds to return the results & for me to navigate to the appropriate page. This is slow enough that it is training me to avoid the delay. I know we don’t have the latest wiz-bang computers out here. But still, I would expect The MathWorks to test these features out with some lowest common denominator type of computer platform during development & include the effect of the performance hit before deciding to include a feature. In this case, I don’t think all the graphics that are displayed are worth what I imagine is the performance hit it costs.
I have the statistics toolbox installed and the plots do not show up in the plot selector.
How do I get the toolbox plots to show up in the selector.
@EddieS,
On the plot selector there is an “All Plots” tab which should have the statistics plots near the bottom. The selector may not allow you to choose the plot for all selected datatypes for that plot function. I’m going to work with the developers to look at that.