
Introducing Trendy!
MATLAB Central is proud to announce our newest community application – Trendy a service for tracking and plotting trends.
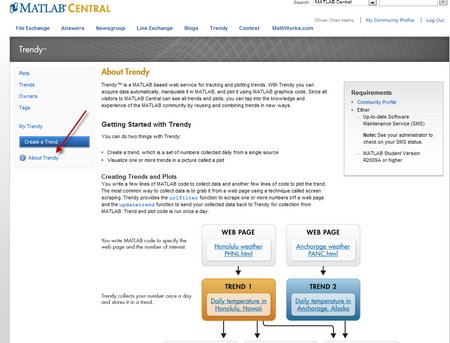
Use Trendy to track data on public webpages by two simple steps:
- Write MATLAB Code to collect your data.
- Write MATLAB Code to visualize the collected data as trends and plots.
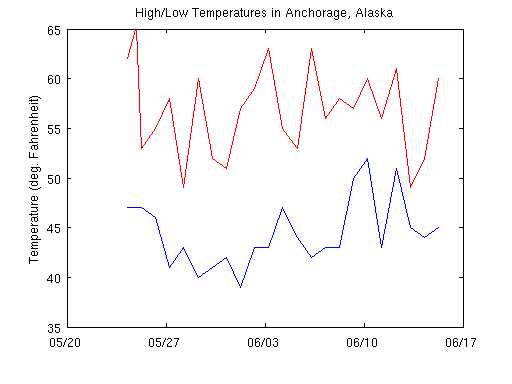
Trendy will collect your data daily and stores it as a trend. Trendy uses your MATLAB code to plot your data, so make sure that you come back to see what your data looks like!
Become a trend-watcher!
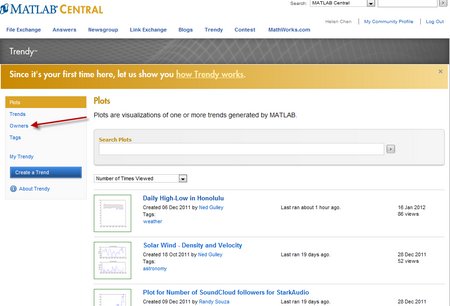
It’s easy and fun to see what trends have been created. Just go to Trendy to check out some plots and trends. If you want to see who are the community trend-makers, click on Owners in the left navigation bar.
Getting started creating trends
If a trend that you are interested in hasn’t been created yet, it’s easy to make your own.
To use Trendy you need to have either up-to-date SMS or MATLAB Student Version R2010a or higher. If you do, get started by logging into your MATLAB Central account.
- Use the
 button to jump in and create your first trend or
 - Check out the “About Trendy” link on the left navigation bar to read about how Trendy works and to access a short tutorial.
Questions or feedback?
Share your thoughts by posting your questions, comments or feedback as a comment to this blog post.
- Category:
- MATLAB Central


Comments
To leave a comment, please click here to sign in to your MathWorks Account or create a new one.