Hey, you know what's fun? Laptop stickers are fun. I'm not sure why, but laptop stickers have a jaunty, upbeat spirit that makes your computer smile at the world. And I know what you're thinking: it... read more >>

Hey, you know what's fun? Laptop stickers are fun. I'm not sure why, but laptop stickers have a jaunty, upbeat spirit that makes your computer smile at the world. And I know what you're thinking: it... read more >>

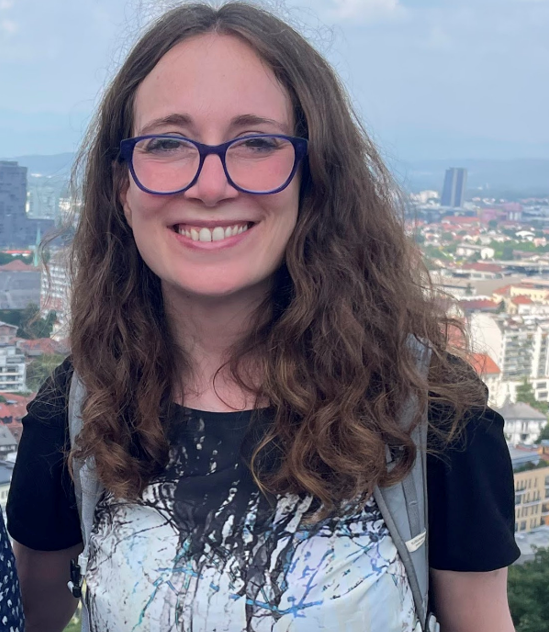
Jenny Bosten is a Mini Hack rock star. The name "Mini Hack" refers to our MATLAB competitions, of which there have been several. For each of these Mini Hack competitions, Jenny has created images and... read more >>
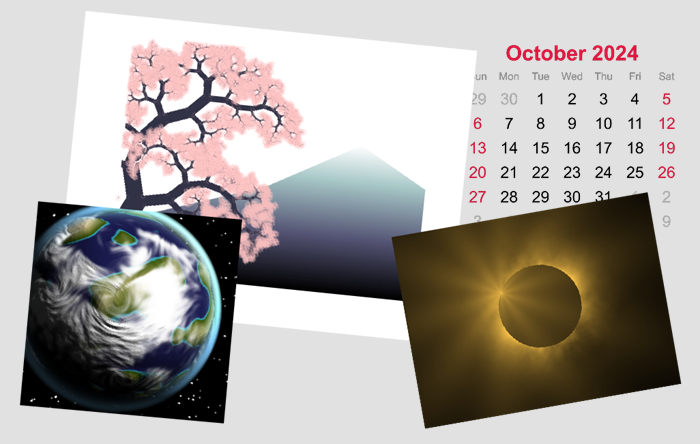
If you visit the Community Contests page, you'll see there have been three different "Mini Hack" contests. These are games where you get a little text area for some MATLAB code that makes cool... read more >>
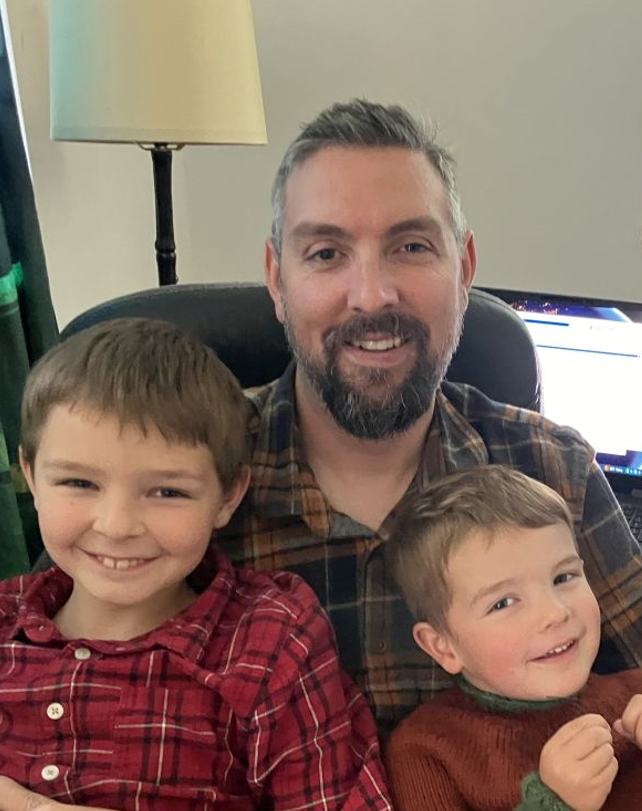
Tim Marston is the 1st-prize winner of 2023 MATLAB Mini Hack contest. His contest entries not only showcase his MATLAB skills and creativity, but also inspire many others to create entries in the... read more >>
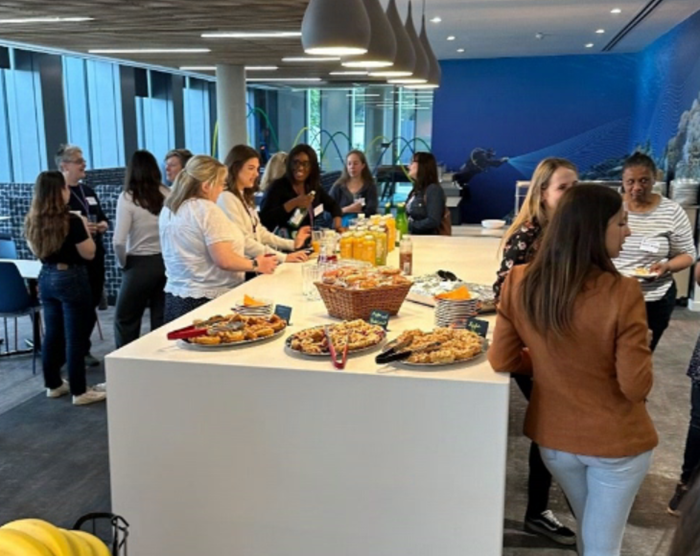
This is a guest post to celebrate International Women in Engineering Day on June 23rd. Written by Alexandra Martinez Rodriguez, Senior UX Researcher, MathWorks and Ruth Faherty, Advanced Support... read more >>
Zhaoxu Liu / slandarer is a winner of the 2023 MATLAB Mini Hack contest and an active contributor to the File Exchange and Discussions. Zhaoxu’s creative Mini Hack contest entries amazed and... read more >>
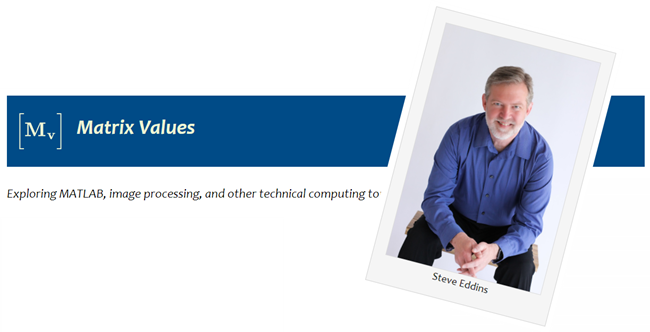
My erstwhile colleague Steve Eddins recently retired from MathWorks after a long and illustrious career. And once he was finally free of the office, what did he long to do? Maybe a few rounds of golf... read more >>
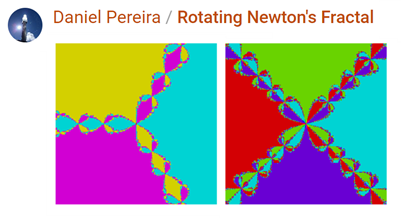
Recently I've seen a number of fractal images created with Newton's method. For instance, Daniel Pereira had two spectacular animations in the recent Flipbook Mini-Hack contest.
Rotating Newton's... read more >>
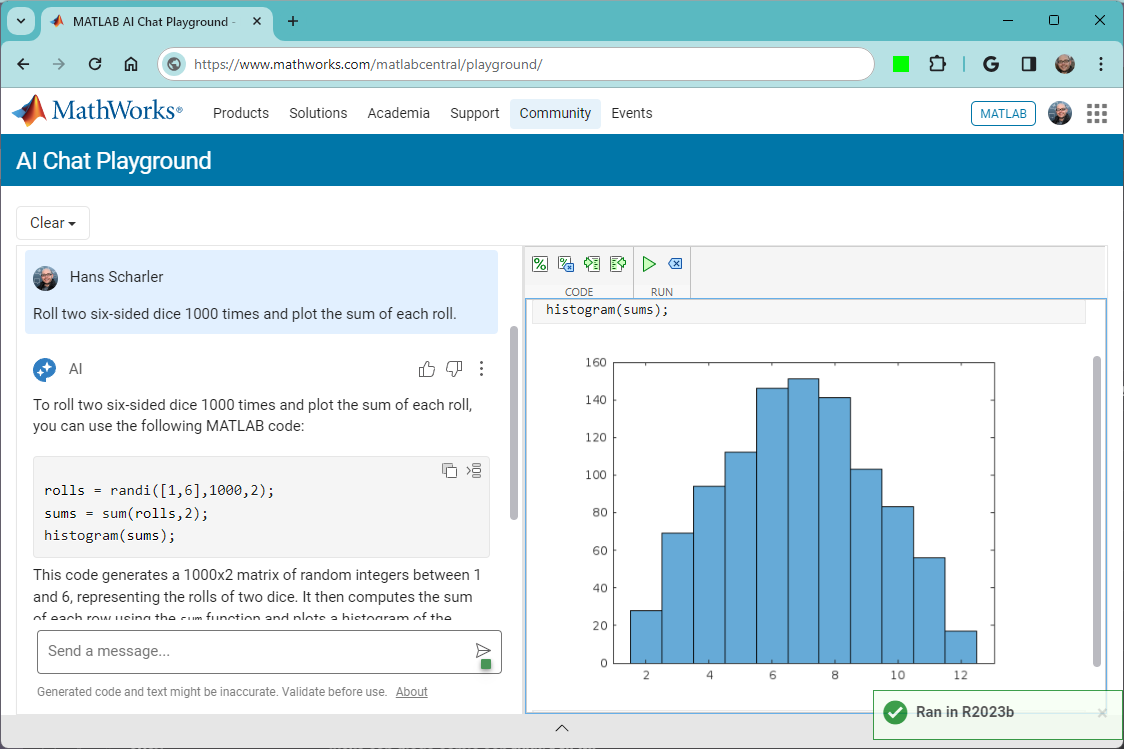
The MATLAB AI Chat Playground is ready for you to experiment with Generative AI, answer questions, and write initial draft MATLAB® code.
All of us on the community team share a guiding principle. We... read more >>

Today we're launching a new contest here on MATLAB Central: the MATLAB Flipbook Mini Hack. Why flipbook? It's an animation contest in which each animation gets exactly 48 frames, so it's like... read more >>
These postings are the author's and don't necessarily represent the opinions of MathWorks.