Loren on the Art of MATLAB

March 25th, 2009

Four Color Images

I recently attended a show at the Institute for Contemporary Art in Boston featuring work by Shepard Fairey. It got me thinking how simple it can be in MATLAB to make a 4-color image and adjust it however you like.

Contents

Import Image

First, let me get an image. This one is a gray-scale image.

Ic = imread('pout.tif');
imshow(Ic)

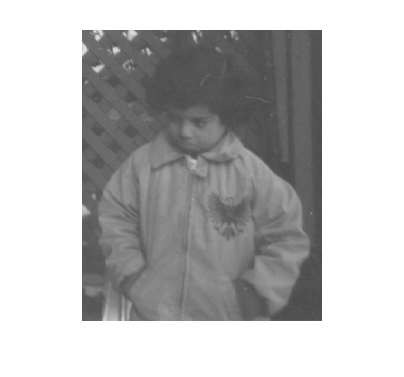
Note: I am using imshow from Image Processing Toolbox to help manage the color and axes scaling.

Define Four Colors

Next let me choose a palette of colors, and display them.

lilac = [.5 .4 .9];
darkblue = [.1 .3 .8];
lightblue = [0 .5 .6];
red = [.8 0 0];
cm = [darkblue;  red; lightblue;  lilac];
image([1 3;2 4]),colormap(cm), axis off

Segment Gray Image into Four Levels

Next I choose levels for grouping pixel values into 4 color bins. The minimum and maximum values of my image are close enough to 0 and 255 to not bother stretching the range.

min(Ic(:))
max(Ic(:))
ans =
   74
ans =
  224

My first attempt at binning creates equal size bins.

levels = linspace(0,255,5)
levels =
            0        63.75        127.5       191.25          255

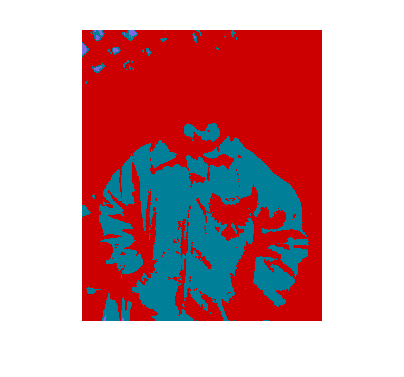
Next I create a new image by combining 4 binary images with the appropriate multipliers.

Idb = (Ic <= levels(2));
Ir = Ic<=levels(3) & Ic>levels(2);
Ilb = Ic<=levels(4) & Ic>levels(3);
Ipy = Ic<=levels(5) & Ic>levels(4);
Ic4 = Idb+2*Ir+3*Ilb+4*Ipy;
imshow(Ic4,cm)

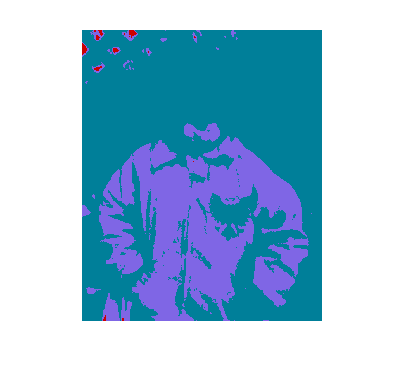
Change the Order of Colors

What happens when I change the color order? Features appear different with different color selections.

cm = [darkblue;  lightblue;  lilac; red];
imshow(Ic4,cm)

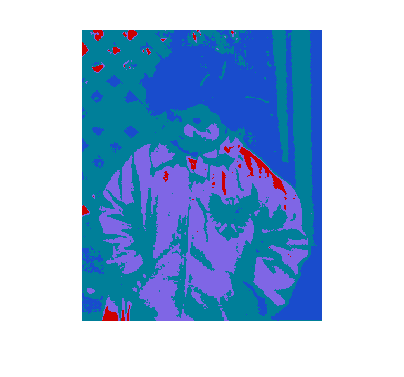
Change Ranges for Four Colors to Bring Out Details

Now I finetune the color bins to emphasis more detail from the original image. I then recalculate the binary images according to the new bins and recombine them.

levels = [0 90 128 155 255]
Idb = (Ic <= levels(2));
Ir = Ic<=levels(3) & Ic>levels(2);
Ilb = Ic<=levels(4) & Ic>levels(3);
Ipy = Ic<=levels(5) & Ic>levels(4);
Ic4 = Idb+2*Ir+3*Ilb+4*Ipy;
imshow(Ic4,cm)
levels =
     0    90   128   155   255

Colormaps are Important

Choosing appropriate colormaps for displaying data is very important. You need to be careful to not exaggerate unimportant details. Here's an interesting reference from one of my geophysics periodicals.

A. Light & P.J. Bartlein, "The End of the Rainbow? Color Schemes for Improved Data Graphics," Eos,Vol. 85, No. 40, 5 October 2004.

Do you have any special colormaps you use for exploring or displaying your data? If so, can you post information (perhaps with links of plots to look at) here?


Get the MATLAB code

Published with MATLAB® 7.8

12 Responses to “Four Color Images”

  1. Oliver Woodford replied on :

    I like colormaps that are colorful, but that are informative when printed in black & white too. I’ve developed a colormap called ‘hicontrast’ which goes through many bright colours, so gives excellent level differentiation, but which converts to linear grayscale in black & white. It’s just one of the many colormaps available with my REAL2RGB FEX submission (id: 23342).

  2. Oliver Woodford replied on :

    Incidentally, as was pointed out to me by Steve Lord on the newsgroup only today, you could use the second output of histc to more easily generate the four color indexed image given the level boundaries.

  3. Jody Klymak replied on :

    Inspired by Light and Bartlein I made a mess of colormaps. The write up is partly a mess, and the code worse, but I’ll post it here for others to play with.

    http://web.uvic.ca/~jklymak/perceptcmap/TestColor.html

    perceptcmap.tgz

    I basically use colCog.m whenever I have data that goes from negative to positive, and I want zero to be washed out. Does much better than jet or a jet-derivative that replaces green w/ white at the middle. A number of colleagues use bright red to bright blue as well (Ts3Shears.jpg) but that always seems to draw my eye to the red more than the blue.

  4. Cris Luengo replied on :

    Hi Loren,

    Instead of manually finding the 3 thresholds you use to divide up the gray-values, you could do something like this. It will find values such that each color gets the same number of pixels:

    h=hist(double(Ic(:)),0:255);
    ch=cumsum(h);
    levels(2)=find(ch<(ch(end)*1/4),1,’last’)-1;
    levels(3)=find(ch<(ch(end)*2/4),1,’last’)-1;
    levels(4)=find(ch<(ch(end)*3/4),1,’last’)-1;

    Talking about color maps, is there any interest at The MathWorks to change the colormap generated by `jet`? It has some very strong bands at yellow and cyan, the blue section is way longer than the red one, and there hardly is any green (which is the color we’re best at distinguishing different shades of). Not that I know how to do it better, but I’m sure there has been quite a bit of research on this over the years.

    Cheers,
    Cris.

  5. Loren replied on :

    Thanks for all the comments! Yes, there are lots of ways to divide the data into bins and Cris shows one that makes the bins approximately equal. I think some will find Jody’s colormap illustration useful too.

    There are no plans to change jet. If you know of particular research or a particular colormap, feel free to point us to it.

    –Loren

  6. Jonas replied on :

    I have been using either grayscale or “perceptual colormaps” as discussed in http://www.research.ibm.com/people/l/lloydt/color/color.HTM ever since I read that article.
    It is amazing how much difference a colormap makes in interpreting data. Check for example peaks (or abs(peaks)) with jet vs grayscale and notice how you are being influenced by the colors.

  7. Jeff Mather replied on :

    I’m glad to see people talking about making colormaps that faithfully represent the data. It’s a big pet peeve of mine to see bad colormaps. (I know this has little to do with the Shep Fairey part of your post. . . .)

    After creating the colors for your colormap, you may want to run some MATLAB code to preview how it will look for the 5% of the population that has some form of color confusion: Color Universal Design and a MATLAB-based Simulator.

  8. Loren replied on :

    Thanks Jonas and Jeff for some more great article links. It’s really worthwhile to take a look at them.

    –Loren

  9. Jody Klymak replied on :

    I updated my page so it is not such a mess.

    I don’t think there is anything inherently wrong with jet. However, I would love to see some of the other Light and Bartlein colormaps made part of matlab, and included in the tutorials. IBM seems to have stalled out on some of this research, but there is enough of it in the public domain that the Mathworks could make some progress.

  10. Rob Henson replied on :

    KMEANS clustering is a nice way to pick the colours.

    [c,ctrs] = kmeans(double(Ic(:)),4,’Distance’,’sqeuc’);
    imshow(reshape(c,size(Ic)),cm);

  11. Bob replied on :

    FYI, an implementation of some Light-Bartlein colormaps is available on the File Exchange.
    http://www.mathworks.com/matlabcentral/fileexchange/17555

  12. Jake replied on :

    I really like the VIVID colormap, especially for contour type plots.
    http://www.mathworks.com/matlabcentral/fileexchange/20848

Leave a Reply

Wrap code fragments inside <pre> tags, like this:

<pre class="code">
a = magic(3);
sum(a)
</pre>

If you have a "<" character in your code, either follow it with a space or replace it with "&lt;" (including the semicolon).


Loren Shure works on design of the MATLAB language at The MathWorks. She writes here about once a week on MATLAB programming and related topics.

  • Loren: Hi Ghazanfar- Please look at the help for the function hist (and perhaps histc). They will do what you want...
  • Ghazanfar Ali: Hi Miss Loren I am in need of an algo to count cosecutive duplicate values in a one dimensional...
  • OysterEngineer: Clearly this is a complex topic & these pair of blogs show that The MathWorks are masters of the...
  • Tim Davis: I’ve often been puzzled about how sub-matrix-assignmen t works for full and sparse arrays: clear A =...
  • Loren: Paul- There *are* issues depending on the sizes of ii and jj. And it’s a bit complicated, but really...
  • Loren: Bob- You don’t say what happens when you run your code. Can you please explain more. It looks like you...
  • Loren: Kishore- It is not clear to me what you are trying to actually achieve. If you want to concatenate the 4...
  • Kishore: sorry, in the previous code mat2cell(c,[19 121],[19 134],[19 84],[19 107])
  • Kishore: Hi Loren, Why does the following not work? data_classwise = [19x121 double] [19x134 double] [19x84 double]...
  • Paul Jackson: Loren, Are there any aspects of empty matrices that may be tricky when they are used as indices into...

These postings are the author's and don't necessarily represent the opinions of The MathWorks.