 Cleve’s Corner: Cleve Moler on Mathematics and Computing
 The MATLAB Blog
 Guy on Simulink
 MATLAB Community
 Artificial Intelligence
 Developer Zone
 Stuart’s MATLAB Videos
 Behind the Headlines
 File Exchange Pick of the Week
 Hans on IoT
 Student Lounge
 MATLAB ユーザーコミュニティー
 Startups, Accelerators, & Entrepreneurs
 Autonomous Systems
 Quantitative Finance
 MATLAB Graphics and App Building
Coordinating Views
Ever wanted to have coordinated views of multiples plots when you pan or zoom? You can do this in MATLAB.
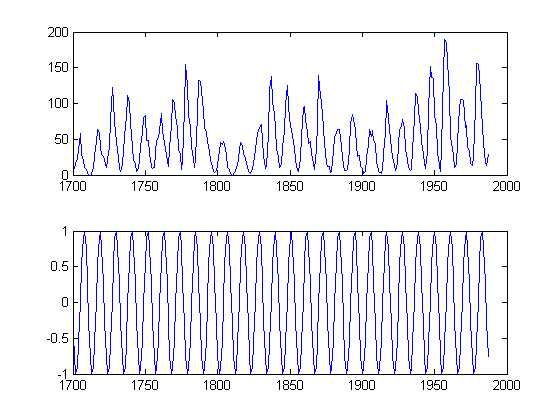
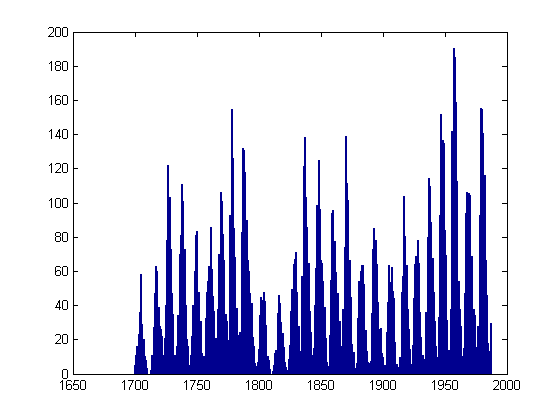
Let's suppose I have two plots and I want to be sure they keep their x-axes synchronized. I'll start by loading the sunspot data.
sdata = load('sunspot.dat');
time = sdata(:,1);
spots = sdata(:,2);
I've heard that there is an 11-year cycle for sunspots. So let me generate a sinusoid with a period of 11 years so we can then do a visual comparison (vs. the more appropriate Fourier analysis!).
cycle11 = sin(time*pi*2/11);
Now let's plot the two curves, but in different axes since the scalings are quite different and I don't want to worry about them.
hspots = subplot(2,1,1);
plot(time,spots)
h11 = subplot(2,1,2);
plot(time,cycle11)
Here I ensure the plots have the same x-axis by explicitly plotting the data using the same x-coordinates. But let's say I want to zoom in now. I can achieve this by setting both x-axes with the same limits. I could do them one at a time, or together.
set([hspots h11],'xlim',[1900 1950]);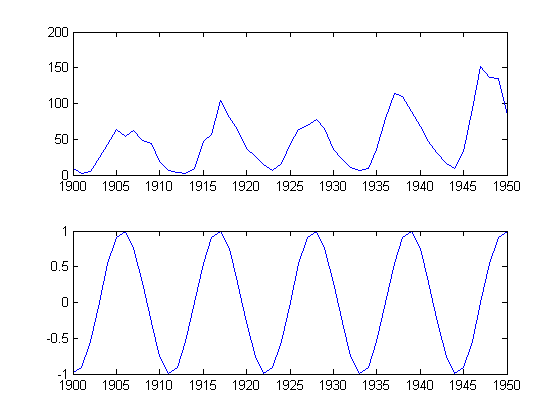
I can still make "mistakes" though, by setting the limits on only one of the axes.
set(h11,'xlim',[1850 1900])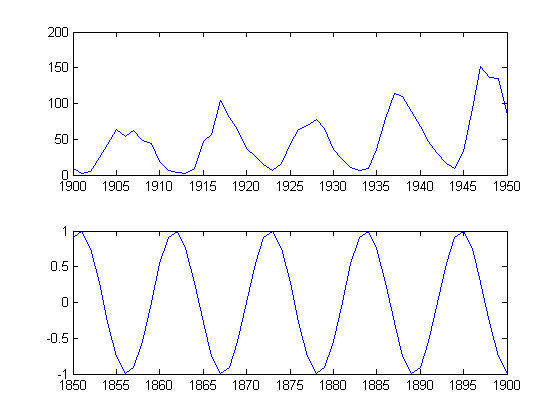
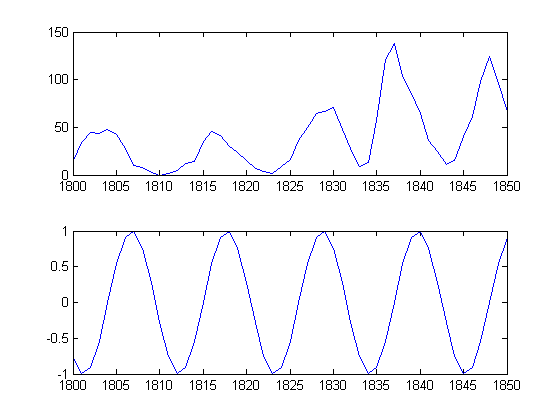
I can achieve the synchronization, with a little less mental effort than carrying around all affected axes, by using the function |linkaxes.
linkaxes([h11 hspots],'x')
set(h11,'xlim',[1800 1850])
Do you have a simple way to coordinate your plots? Let me know here.
- Category:
- Graphics,
- Less Used Functionality


Comments
To leave a comment, please click here to sign in to your MathWorks Account or create a new one.