In a recent post I discussed how to use different linestyles, colors, and marker properties to ensure that lines are markers that you superimpose on a plot will be visible, regardless of what the underlying picture is. Today I will show another technique that works for overlaying images or patches on a plot.
Contents
Let me show how to peek under a patch overlying an image.
load clown image(X),colormap(map) hold on xx = [150 230 230 150]'; yy = [40 40 110 110]'; hp = patch(xx,yy,'g');
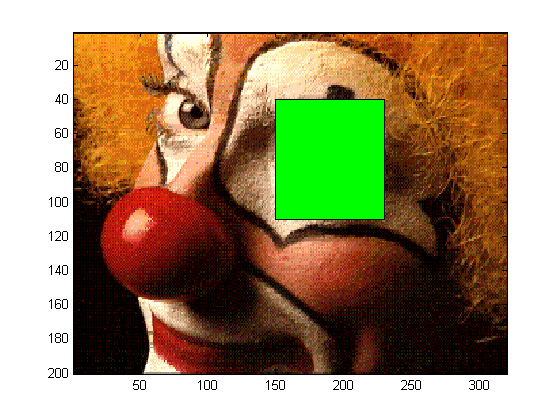
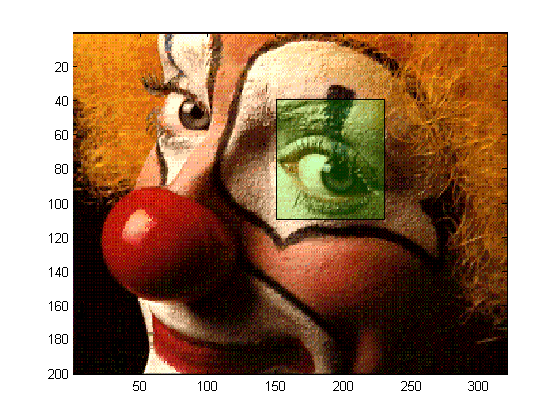
As you can see, the green patch I placed on top of the eye makes it impossible to see the covered region of the image. To get a hint at what lies underneath, I can change the transparency of the patch, by changing the transparency of the patch face.
set(hp,'FaceAlpha',0.2) hold off
What Techniques Do You Use?
Do you have any interesting visualization techniques to share for combining more lines, patches, etc. with other graphical components? Please share them here.
Get
the MATLAB code
Published with MATLAB® 7.10


Hi,
I’m not sure if this counts but I just finished figuring out how to combine images with 3D plots, where the image is shown as a plane underneath a 3D surface and where image and surface have different color maps.
Example and explanation here: http://www.peteryu.ca/tutorials/matlab/image_in_3d_surface_plot_with_multiple_colormaps
Code that produces it:
% the data that you want to plot as a 3D surface. [x,y,z] = peaks; % get the corners of the domain in which the data occurs. min_x = min(min(x)); min_y = min(min(y)); max_x = max(max(x)); max_y = max(max(y)); % the image data you want to show as a plane. planeimg = abs(z); % scale the between [0, 255] in order to use a custom color map for it. minplaneimg = min(min(planeimg)); % find the minimum scaledimg = (floor(((planeimg - minplaneimg) ./ ... (max(max(planeimg)) - minplaneimg)) * 255)); % perform scaling % convert the image to a true color image with the jet colormap. colorimg = ind2rgb(scaledimg,jet(256)); % set hold on so we can show multiple plots / surfs in the figure. figure; hold on; % do a normal surface plot. surf(x,y,z,'edgecolor','none'); % set a colormap for the surface colormap(gray); % desired z position of the image plane. imgzposition = -10; % plot the image plane using surf. surf([min_x max_x],[min_y max_y],repmat(imgzposition, [2 2]),... colorimg,'facecolor','texture') % set the view. view(45,30); % label the axes xlabel('x'); ylabel('y'); zlabel('z');I have relied on alpha transparency techniques like the one described in my somewhat popular subplot manipulation and selection tools, Select subplots and Allowaxestogrow.
However, transparency requires OpenGL on most systems. Matlab’s inconsistent, even buggy support for OpenGL in hardware vs. software, or on NVidia vs. ATI cards (driver bug workarounds are required), makes it very difficult to rely on transparency and expect cross-platform support.
Loren, does alpha-blending/transparency now print nicely to ps/eps formats?
Bjorn,
There have been no recent changes to the ps/eps output generation modules.
Dear Loren,
I’ve a problem about drawing order. I’ve plotted in a figure the contour plots of a variable. In this figure I’ve also plotted some vectors with “quiver”. Now the point is, I would like to shade in a area the vectors. Thus, i create a poligon and i’ve filled it, but it doesn’t work. the vectors continue be there over the filled area. I would try to draw vectors under the filled are, how can i do?
plz help me!
Vince-
I recommend you contact technical support. They should be able to help you here. You will need to supply them with specific code to demonstrate your example. The link for support is on the right of the blog.
–Loren