 Cleve’s Corner: Cleve Moler on Mathematics and Computing
 The MATLAB Blog
 Guy on Simulink
 MATLAB Community
 Artificial Intelligence
 Developer Zone
 Stuart’s MATLAB Videos
 Behind the Headlines
 File Exchange Pick of the Week
 Hans on IoT
 Student Lounge
 MATLAB ユーザーコミュニティー
 Startups, Accelerators, & Entrepreneurs
 Autonomous Systems
 Quantitative Finance
 MATLAB Graphics and App Building
Earth and moon visualization
This week’s pick comes from two of my colleagues in the UK, Sam and Marta. This is a cool visualization of the Earth and its moon at the proper ratio, but not the proper distance apart. The code is very simple, and one thing I liked about it is how they were able to drape real satellite imagery over the spheres:
topo=imread('earth_lights_small.jpg');

topoud=flipdim(topo,1);
set(s,'facecolor','texture');
set(s,'cdata', im2double(topoud));
This is a nice technique for making visualizations more realistic and appealing.
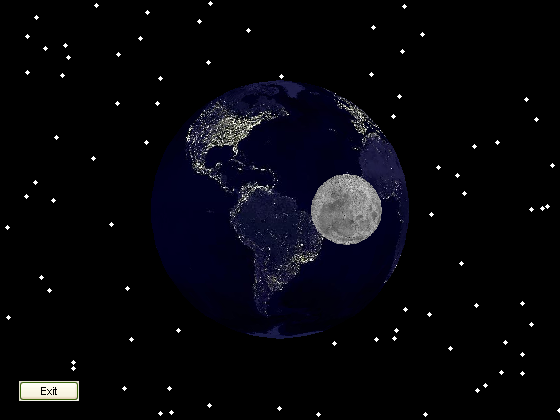
Also, notice that they added a quick GUI button to the figure window with one command:
u=uicontrol('style', 'togglebutton', 'value', false, 'string', 'Exit');
They then wait for this button to be pressed so that they can close the window:
while ~get(u, 'value')

    rotate(s,[0,0,1],1,[0,0,0]);

    rotate(s2,[0,0,1],0.0357,[0,0,0]);

%     camorbit(15,0)

    pause(0.1)

end

close(f)
While they are waiting for the user to click the button, they keep rotating the spheres. You can also see some commented out lines of code that are likely to be of interest to people that want to further modify the code later.
[note: Post updated April 23rd to add link to original code. Oops!]


See Also
-
Satellite Trajectory
Blogs
-
Fit a Sphere!
Blogs
-

Signoff
Blogs


Comments
To leave a comment, please click here to sign in to your MathWorks Account or create a new one.