File Exchange Pick of the Week

September 10th, 2007

Small multiples of plots made cleaner

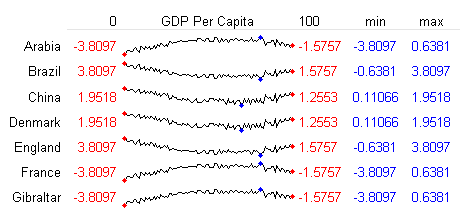
Those of us that are followers of data visualization guru Edward Tufte often want to use small multiple that allow you to see thumbnails of related data all at once. In MATLAB, that will often cause ‘axis build-up’ where you have way too many axis showing. This pick by Gautam solves that.

Leave a Reply

Wrap code fragments inside <pre> tags, like this:

<pre class="code">
a = magic(3);
sum(a)
</pre>

If you have a "<" character in your code, either follow it with a space or replace it with "&lt;" (including the semicolon).


Bob, Brett & Jiro share their favorite user-contributed submissions from the File Exchange.

  • Zach: Hi Doug and Les, I didn’t have a lot of time to mess with this, but I did find a work-around. I plotted...
  • hamed: k
  • Les: @Zach This isn’t exactly what you are looking for but at least it puts all three parameters on the same...
  • Zach: Thanks for your suggestions Doug. I’ll give that a shot and see what happens. I’ve seen many of...
  • Doug: @Zach, I would say to use plotYYY, because that is close to what you want, but using depth as Y makes sense....
  • Doug: @Teja, I think this will work: http://www.mathworks .com/access/helpdesk /help/techdoc/ref...
  • Gify: merry christmas :) nice christmas tree! Regards, Janet Gify
  • Teja: Dear Doug Is there anyway to plot a surface from nonuniform data without meshgrid and griddata? Basically i...
  • Zach: I’m working with geophysical data, so I’d like to produce a depth profile. The y-axis would be...
  • Doug: @Ashok First, please do not use variable names that are MATLAB commands (std and mean). Second, p(j) should be...

These postings are the author's and don't necessarily represent the opinions of The MathWorks.