 Cleve’s Corner: Cleve Moler on Mathematics and Computing
 The MATLAB Blog
 Guy on Simulink
 MATLAB Community
 Artificial Intelligence
 Developer Zone
 Stuart’s MATLAB Videos
 Behind the Headlines
 File Exchange Pick of the Week
 Hans on IoT
 Student Lounge
 MATLAB ユーザーコミュニティー
 Startups, Accelerators, & Entrepreneurs
 Autonomous Systems
 Quantitative Finance
 MATLAB Graphics and App Building
Streamlining a manual image-processing workflow.
Note
The file submission referenced in this post is no longer available on File Exchange.
Brett's pick this week comes to us from fellow MathWorker Sam Roberts. Sam is quite proficient with our tools, and has posted several very useful demos --primarily for solving typical problems in the life sciences. His tutorial and code on "Quantitative High-Throughput Gene Expression Imaging" gives a great introduction to how one might solve a real-world problem once, then leverage that work to batch process the next hundred (or thousand, or hundred thousand) images.
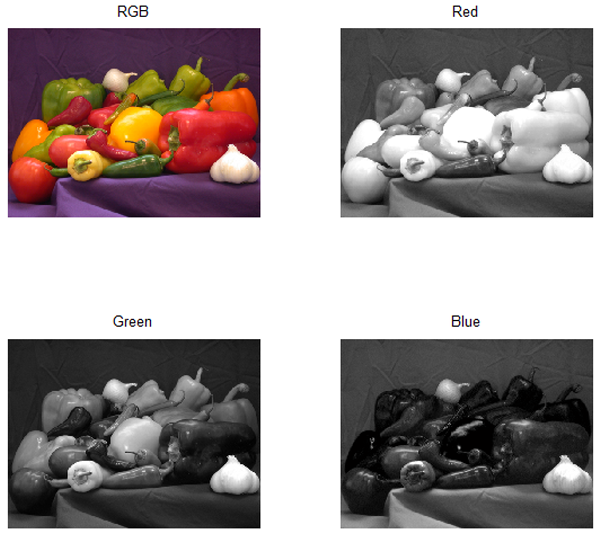
Specifically, this demo describes an approach to solving a problem in immunofluorescent histochemistry. He initially reads in an image of the embryo of a fruit fly, which has been stained with different antibody-tagged fluorophores that bind selectively to different gene products. The dyes stain specific proteins blue, red, or green:
Sam then demonstrates how to explore the individual color planes of this RGB image (to detect the differential staining), and how to automatically rotate the embryo to have its major axis be horizontal. He shows us how to segment and filter the image, and how to extract profiles of gene expression along the axis of the embryo.
Next, Sam describes how one might focus on the portion of these data that are most informative, and how to fit smoothed splines to the profiles.
As if that weren't enough, Sam demonstrates how one might scale the problem up to work on a cluster using the MATLAB Distributed Computing Server.
Finally, to cap things off, Sam has captured and described all of this great functionality in an html document that really shows off the impressive publishing capabilities that are built into MATLAB, and he describes how one can use the MATLAB Report Generator to create more intricate custom reports on the results.
This is a great demo for someone who wants to understand how to solve--and automate--real-life problems in image processing using MATLAB tools.
Comments?
- Category:
- Picks


Comments
To leave a comment, please click here to sign in to your MathWorks Account or create a new one.