 Cleve’s Corner: Cleve Moler on Mathematics and Computing
 The MATLAB Blog
 Guy on Simulink
 MATLAB Community
 Artificial Intelligence
 Developer Zone
 Stuart’s MATLAB Videos
 Behind the Headlines
 File Exchange Pick of the Week
 Hans on IoT
 Student Lounge
 MATLAB ユーザーコミュニティー
 Startups, Accelerators, & Entrepreneurs
 Autonomous Systems
 Quantitative Finance
 MATLAB Graphics and App Building
All about pixel colors: Reference information
Note
See the following posts for new or updated information about this topic:
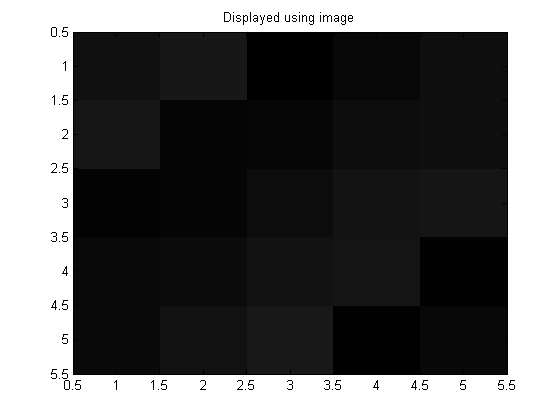
In this posting I want to summarize all of the factors that control image pixel colors in MATLAB. This information is in the MATLAB documentation, but it is scattered around in several locations. If this is way too much detail for you, that's OK - just come on back next week!
Contents
image - CData dimensionality
- If the image CData is three-dimensional, with the size of the third dimension equal to 3, then the CData values are taken to represent RGB values directly. No other image, axes, or figure properties affect the displayed colors. We sometimes call these "truecolor images."
- If the image CData is two-dimensional, then the image display colors come from the figure colormap. CData values are used (either directly or in scaled form) as lookup indices into the colormap.
image - CData class
- For truecolor images, the class of the CData array (uint8, uint16, or double) affects which values are displayed as white. The triple [0 0 0] is always black. For double CData, [1 1 1] is white. For uint8 CData, [255 255 255] is white. For uint16 CData, [65535 65535 65535] is white.
- For direct indexed images, the class of the CData array affects the indexing operation. For double CData arrays, the value 1 corresponds to the first colormap color. For uint8 or uint16 CData arrays, the value 0 corresponds to the first colormap color.
image - CDataMapping
If the image CData is two-dimensional, then the image display colors come from the figure's colormap, and the image CDataMapping property controls how the colormap lookup is done.
- If CDataMapping is 'direct', then CData values are used directly as lookup indices into the colormap.
- If CDataMapping is 'scaled', then CData values are scaled to form lookup indices into the colormap.
For truecolor images, the CDataMapping property has no effect on the displayed pixel colors.
axes - CLim
If the image CData is two-dimensional, and if the image CDataMapping is scaled, then the two-element axes CLim property determines the scaling function. The first element gives the value that maps to the first colormap color, and the second element gives the value that maps to the last colormap color.
For truecolor images, or if the image CDataMapping property is 'direct', the CLim property has no effect on the displayed pixel colors.
figure - Colormap
If the image CData is two-dimensional, then all displayed pixel colors come from the figure Colormap.
For truecolor images, the Colormap property has no effect on the displayed pixel colors.


Comments
To leave a comment, please click here to sign in to your MathWorks Account or create a new one.