Steve on Image Processing

June 10th, 2006

Determining point positions in MRI peg phantom

Blog reader Jonathan from St. Jude Children's Research Hospital sent me an image derived from an MRI peg phantom:

bw = imread('http://blogs.mathworks.com/images/steve/62/mri_peg_phantom.png');
imshow(bw)

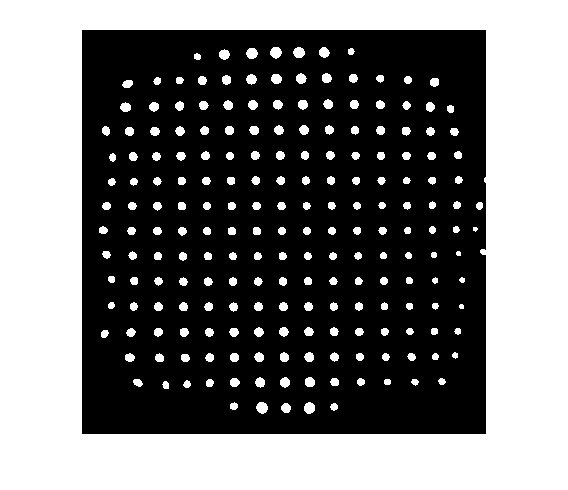
Jonathan wanted to know how to determine the position of each point. The functions bwlabel and regionprops do the trick.

The function bwlabel takes a binary image and figures which groups of white pixels are connected to each other.

L = bwlabel(bw);

The output L is called a label matrix. It has the same size as bw and contains nonnegative integers. Each positive integer value corresponds to a particular object. For example, to display the 10th object, just compare L to 10:

imshow(L == 10)

The function regionprops computes a number of different geometric properties of all the different regions contained in a label matrix. All we need for this application is the centroid:

s = regionprops(L, 'Centroid')
s = 

205x1 struct array with fields:
    Centroid

The size of the structure array s tells you the number of labeled objects: 205. The centroid of the 10th object is:

centroid_10 = s(10).Centroid
centroid_10 =

   44.1687   77.8072

Here's a simple way to superimpose the centroid locations onto the original image:

imshow(bw)
hold on
for k = 1:numel(s)
    plot(s(k).Centroid(1), s(k).Centroid(2), 'x')
end
hold off

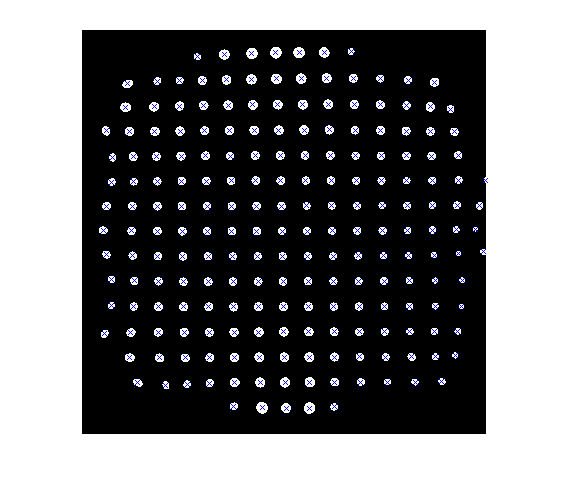
Thanks for letting me show this image in the blog, Jonathan.


Get the MATLAB code

Published with MATLAB® 7.2

33 Responses to “Determining point positions in MRI peg phantom”

  1. image processing using geometric analysis replied on :

    our project is about image processing using matlab and with geometric analysis

  2. hamza replied on :

    hidden data

  3. judith replied on :

    we are from india, doing our final year project in digital image processing our title is “Real Time Contour Tracking”
    using matlab
    we need help based on this:
    we get a live video and then give delay between the frames such that we get 6 to 7 frames per second.
    Then the processing stage where FFT,filtering and tracking the particular moving object in square and IFFT.
    We very eagerly wait for your reply.

  4. nia replied on :

    hi Jonathan,

    im quite new in image processing. i dont really understand how does the bwlabel function work. how can it determine that the object shown in the result is the 10th object. hopefully u can kindly explain this to me.

  5. Steve replied on :

    Nia - I am Steve, not Jonathan. Anyway, there is some basic information on the algorithm used by bwlabel in the documentation. The information includes a textbook reference. See this page .

  6. Loku replied on :

    Hi Jonathan,

    I am new to image processing and acquistion. I want to refer to a point in an image and also find a path in the image(having 3cm path coloured white in white whereas the rest of the image is coloured blue or red). How do i do this?

  7. Steve replied on :

    Loku - I’m not sure what you mean by “refer to a poing in an image.” Can you say more? Regarding finding a path according to a particular color, you might want to look at this Image Processing Toolbox demo on color segmentation. By the way, my name is Steve, not Jonathan.

  8. Loku replied on :

    Hi Steve,
    Say,i have a maze and a ball. I want to accomplish the process of moving the ball from one corner to the centre of the maze. I have controls to tilt the board and hence the board moves. I wanna write an algo for this. By referring to a point,i meant the centre of the path in the maze.

  9. Steve replied on :

    Loku - That sounds like an interesting problem, but I don’t have any particular suggestions for you. Good luck with your project.

  10. ruth replied on :

    Hi,is there some other way of getting the centroid of an image without using regionprops.

  11. Steve replied on :

    Ruth - here’s how you might find the centroid of a particular object in a labeled image, if that’s what you mean:

    [y,x] = find(L == 10);
    centroid = [mean(x) mean(y)];
    
  12. jerry replied on :

    hi, is there any way to do a shape detection for each label image?

  13. jerry replied on :

    let say for detecting a rectangular

  14. Steve replied on :

    Jerry - consider searching for references on using something like the Hough transform to do rectangle detection. I’m personally not that familiar with the methods.

  15. Prasun replied on :

    Hi Steve ,
    How can we go about segmenting an image where the shapes are distinct but occluded ie one object in the front masks another
    to some extent .

    Thanks

  16. Steve replied on :

    Prasun - Image segmentation problems are almost always highly specific to particular image data sets. It’s hard to give generically useful advice …

  17. homi replied on :

    hi,
    I am new in matlab , working on image proceesing , Now i am facing problem to reduce x, y values . For example if by using for loop i got 400/300 values but i need only 40 values. Remember i have done edge detection using canny now I want to do feature extraction.

  18. Steve replied on :

    Homi—I do not understand your question. Can clarify your question and be a lot more specific about what you’ve tried, and why the result wasn’t what you wanted?

  19. homi replied on :

    OK I explain you I am doing fish classification. At the moment I completed my preprocessing , now 2nd step is feature extraction for example I want to compare length of one fish to another , there fins etc and also whole body . Now question is this when I retrieve contour values I want to reduced them for about only 40 values how I do this and furthermore I need to compare different features of fish fins, tails so I need center of gravity to calculate up , down values . This is my idea if you can help me any other way then i will be really thankful to you. I need some specific commands for this work and some help to do this.

  20. Steve replied on :

    Homi—It sounds like you are looking for a polygon approximation of an object boundary. You could try the minimum perimeter polygon function in the book Digital Image Processing Using MATLAB, or you could search online for other polygonal approximation algorithms. For computing the center of gravity and other measurements, use the regionprops function. For computing the center of gravity weighted by pixels values, see this recent post.

  21. humera replied on :

    hi,
    if i want to display any special charcter i.e ‘*’ on the boundary of image for example image of butterfly how matlab works with it ?Becuase you talk only about centroid what about whole image i tried with for loop but failed….

  22. Steve replied on :

    Humera—I do not understand your question. Please be more specific about what are trying to achieve, and what code you have already tried.

  23. humera replied on :

    Sir, I got answer thanks for your reply. I was doing a simple mistake while plotting row and col values.

  24. homi replied on :

    Hi Steve, I am again facing problem , I extract contour values of fish image by using 8-connectors algorithm but it is very huge data points to train neural network.I want to reduced my data points I tried polygon approximation but it is not that what I need (till I undedrstand) can you please help me how I reduced my counter values using Matlab. I will be really thakfull to you.I also attached my source code.

    function C = contour(BW)

    [m,n]=size(BW);
    Itemp=zeros(m+2,n+2);
    Itemp(2:(m+1),2:(n+1))=BW;
    BW=Itemp;
    %figure , imshow(BW);
    BW = BW - imerode(BW,[0 1 0 ; 1 1 1 ; 0 1 0]);
    BW = bwmorph(BW,’thin’,Inf);

    if (sum(sum(BW))3),(([C(1,:) C(2,:)]==[C((end-1),:) C(end,:)])))),
    ended=1;
    end;

    direction = MAJ((mod(direction,8)+1));

    end
    C=C(1:(end-1),:);
    C=C-1;

    pixval on

  25. Steve replied on :

    Homi—Why is polygon approximation not what you need?

  26. yasmeen replied on :

    Dear Steve, I would like to seek your help on the following:
    I want to detect many moving objects in vertical lines in video , how can I code it please, thanks in advance

  27. Steve replied on :

    Karthik—I already responded to your question about cricket-player detection code. I have none, and I will delete repeats of this question.

  28. Amani replied on :

    I want to know what this means : BoundingBox(3)

  29. Administrator replied on :

    Amani—Look at the documentation for the regionprops function. Specifically look at the description of the ‘BoundingBox’ measurement.

  30. Amani replied on :

    hi
    I looked at it, but I want more explainiton.

  31. Steve replied on :

    Amani—If the input label matrix is two-dimensional, then BoundingBox is a four-element vector. The first two elements give the coordinates of the upper left corner of the box. The third and fourth elements give the width and height of the box.

  32. Keely replied on :

    Hi Steve,
    I am plotting contours of water data across the globe. I have found a way to zoom in on a region of interest, say North America, using xlim and ylim. However, I now want to extract the data for the zoomed in region. I want to create a matrix which stores the position and value for the whole box, as well as just for the region within a particular contour I choose. Thanks for any help.

  33. Steve replied on :

    Keely—Are you looking for something more besides extracting a subimage? As in f_sub = f(r1:r2, c1:c2)?

Leave a Reply

Wrap code fragments inside <pre> tags, like this:

<pre class="code">
a = magic(3);
sum(a)
</pre>

If you have a "<" character in your code, either follow it with a space or replace it with "&lt;" (including the semicolon).


Steve Eddins manages the Image & Geospatial development team at The MathWorks and coauthored Digital Image Processing Using MATLAB. He writes here about image processing concepts, algorithm implementations, and MATLAB.

  • Sana: hi steve, could you explain to me how i would be able to use the dir function, to do a loop through a directory...
  • Nishtha: Sir, I have preprocessed the image in following steps: [1] adaptive histogram equalization [2] thresholding...
  • Kristof: I also strongly support the idea. I have just recently bumped into the problem that im2single was not...
  • Steve: David—I’ m glad you found it useful!
  • David Lalejini: I found your example very useful for finding connected nodes in a large set of input pairs. I start...
  • tommy: Dear Steve, I have a question,please if you are kind to help me regarding the accumulator array dimensions of...
  • Steve: Abc—I don’t know how to distinguish the faces. You might try posting your question in the MATLAB...
  • Manju: well if we have a few ovals within each other like in a cell how do we measure the distance from the center...
  • Steve: Manju—What do you mean? How is each region defined?
  • Manju: if we have 2-3 regions within each other how do we measure the regions of each one?

These postings are the author's and don't necessarily represent the opinions of The MathWorks.