A post in comp.soft-sys.matlab this week (see the third post in this thread) asked how to display graphically the numerical labels associated with each labeled object. In this blog I'll show a couple of ways to approach that task.
First, let's back up a bit. We're talking about labeling connected groups of pixels in binary images. Here's an example, starting with the grayscale image coins.png.
I = imread('coins.png');
imshow(I)
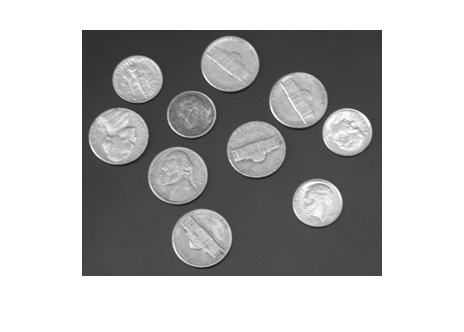
Threshold to form a binary image.
bw = im2bw(I, graythresh(I)); imshow(bw)
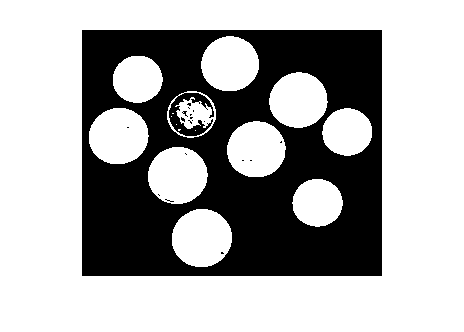
Fill in the holes.
bw2 = imfill(bw, 'holes');
imshow(bw2)
You can easily see that there are 10 objects in the image. But to start doing geometric measurements, we have to be able to identify which foreground pixels belong to which object. That's what bwlabel does.
L = bwlabel(bw2);
L is a label matrix. It's the same size as bw2. It contains the value 0 in each location that's a background pixel. It contains positive integer values in locations corresponding to a labeled foreground object. For example, to see the eighth object, you just determine all the elements of L that equal 8:
imshow(L == 8)
title('Object 8')
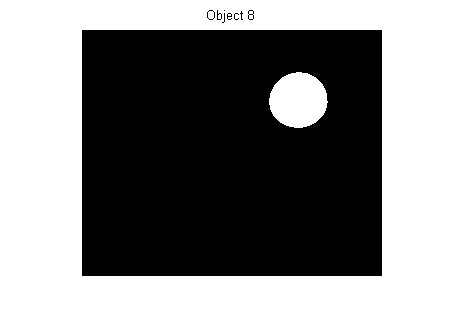
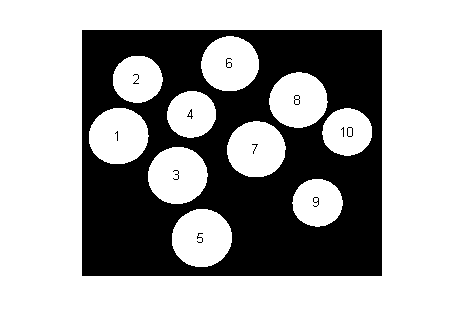
Getting back to the original question - How can we graphically display each object's label? One way is to compute the centroid of each object, and then superimpose text strings on top of the image at the centroid locations. Here's one implementation:
s = regionprops(L, 'Centroid'); imshow(bw2) hold on for k = 1:numel(s) c = s(k).Centroid; text(c(1), c(2), sprintf('%d', k), ... 'HorizontalAlignment', 'center', ... 'VerticalAlignment', 'middle'); end hold off
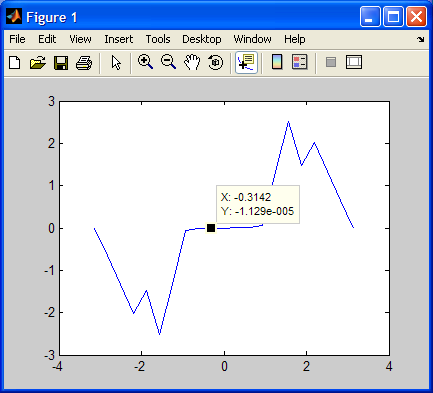
My second method is more interactive. It uses a fairly new MATLAB feature: Data cursors.
If you haven't seen MATLAB data cursors before, here's a screen shot showing what happens when you click on a plot in data cursor mode.
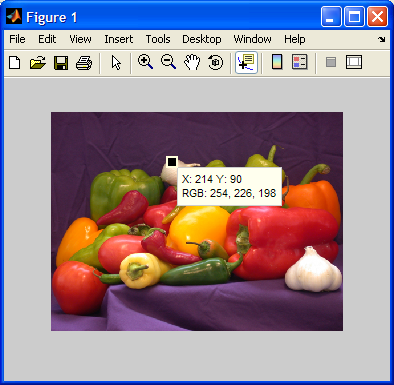
Data cursors work for images, too:
With a modest bit of programming (see Customizing Data Cursor Text), you can customize the data cursor strings. Here, we just want the object label to be displayed. I wrote a little function called display_label_matrix that does just that. It's just a dozen lines of code. Here's what it looks like for the coins example:
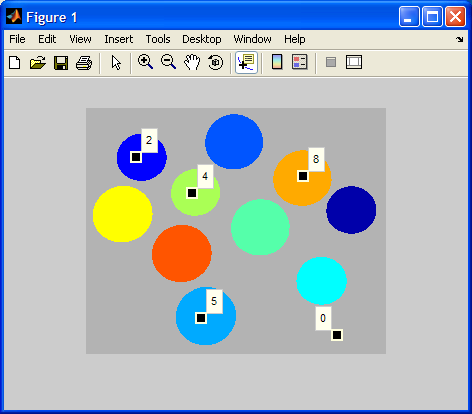
And here's the code:
type display_label_matrix
function display_label_matrix(L)
% display_label_matrix Display label matrix with custom data cursors
% display_label_matrix(L) displays the label matrix L as colored objects on
% a gray background. It also installs a custom data cursor handler in the
% figure. In data cursor mode, clicking on an object displays a data
% cursor containing the object's number.
% Steve Eddins
% Copyright 2006 The MathWorks, Inc.
% $Revision: 1.1 $ $Date: 2006/11/17 19:11:30 $
rgb = label2rgb(L, 'jet', [.7 .7 .7], 'shuffle');
h = imshow(rgb);
% Store the label matrix so that the custom data cursor function has access
% to it.
setappdata(h, 'LabelMatrix', L);
% Enable the figure data cursor mode, and use our own custom data cursor
% strings.
dcm = datacursormode(ancestor(h, 'figure'));
set(dcm,'Enable','on', ...
'Updatefcn', @dataCursorText);
%==========================================================================
function output_text = dataCursorText(obj, event_obj)
% Respond to a user click in data cursor mode by displaying the label
% number of the pixel that was clicked on.
h_image = get(event_obj, 'Target');
pos = get(event_obj, 'Position');
L = getappdata(h_image, 'LabelMatrix');
clicked_label = L(round(pos(2)), round(pos(1)));
output_text = sprintf('%d', clicked_label);
%--------------------------------------------------------------------------
Give it a try and let me know what you think.
Get
the MATLAB code
Published with MATLAB® 7.3


It’s great! I remember…
Thanks a lot. That’s a terrific time save!
I had the same idea, including the use of “setappdata”.
But, Steve, please let me know:
What do you mean ehn you say “old habits dye hard”?
I’m still working in Matab 7 (R14, SP3) environment.
Is there a better way to do this in the newer versions?
If so, PLEASE PLEASE let me know???!!!
Shlomi – I meant that my use of setappdata was an “old habit.” In MATLAB 7 I use nested function handles instead, as described in my November 21st post.
Its a good work and intresting thing.
Please whould ou provide me with aprogram in matlab that can detrmine the number of coines in an image and the number of each type . deiffernt coines shapes and surfase.
and the amount of each type and the total of all types. with a good interface for users.
Best Regards
Yasser Jariri
Yasser – Providing MATLAB programs is beyond the scope of this blog. See my blog policies post.
Dear Steve,
My name is Vy and I am hoping that you can help me with a piece of code. Taking the coins image above (bw2) as an example, I need a way to approximate the minimum polygonal area that is necessary to ‘bound’ all the coins. This would be like the use of the ‘BoundingBox’ function for regionprops. HOWEVER, the objects are not necessarily distributed in a box pattern and I can not accept the extra area. For example, if the coins were arranged in a cicle, the box area would be too big…
I had the idea that if I could draw connecting lines between all centroids of the objects, and then fill in the holes that would give me the necessary polygon… but then I don’t know how to draw the necessary lines on the image.
As you can guess, I am a newbie to Matlab coding.
Thank you very much for your time!
V.
Dear Steve,
I am writing with the happy news that you can disregard my previous question. I have since discovered the regionprops-ConvexImage and ConvexArea functions.
Sorry for my newbie question and thank you for your time.
V.
Steve
Can you please help guide me on how to place a grid on an exisiting image. I need to segment my given images in order to be able to pick out image feature such as dots and spaces. I can use the above technique to identify image features but can someone tell me how to place a grid on image.( sample image: http://will.dwinnell.com/will/BATCH8A.JPG )
any help will be appreciated. thanks
Natasha – See this post: http://blogs.mathworks.com/steve/?p=111
Great blog Steve,
Labeling on an image is quite useful. It seems like a silly question, but after applying the labels, I’m having a hard time saving the annotated image. When I do this with .avi files, a getframe call grabs the frame plus what I wrote on it (like for time counters). But doing this with a .tif and a call to getimage after writing on it doesn’t get the annotations. What am I missing here?
Best Regards,
Rob
Hey Steve,
Maybe a better question than the one I asked in #10 above is: How do I save the annotated image without resampling it?
When I draw on an image, then use getframe, it takes a snapshot of what’s on the screen. Problem is, if I’m annotating a hi-res image then I lose a lot since it doesn’t fit all on my screen at 1:1 scale.
Is there a way to draw over the image, then save the annotated image at the original resolution?
TIA for your thoughts on this,
Rob
Rob – Yes, getframe is always going to do basically a screenshot. If you want higher resolution, your best bet is to use the print function. You can specify the desired output resolution with the -r switch.
hi steve i want a small help could you explain me how i can extract frames from a avi file using matlab and also one more question does a frame and a image considered as same or not?
Gani – The MATLAB function aviread can be used to extract one or more frames from an AVI file, and an extracted frame can certainly be regarded as an image.
I’m using a customized tooltip in a similar flavor to what you have, but when I click on the figure, the actual registered click is displaced by something around 50 pixels below and to the left. Even when I try and zoom in, the zoom box does not start from where the cursor is, but rather, about 50 pixels below and 50 pixels to the left. It seems to do this when plotting lots of data points and the displacement varies from plot to plot.
Thanks for the useful data cursor tricks, but is there a way to create new data cursors and position them at specific indecies when the figure is first drawn without requiring a user to click anywhere?
Hello,
I am trying display label matrix thing with a 3D plot of data points.All i want is to add a fourth dimension in display along with 3D info.
Above method does not help for it.
Please look into it and suggest something.
Regards
Aditya
Aditya – Your question is not very specific, and it sounds more like a general graphics / visualization question. So I’m going to suggest you look through the graphics and visualization chapters in the MATLAB Users Guide. For example, take a look at the Graphics or the 3-D Visualization chapters.
Hello Steve thanks for the concerned reply..yet i have already visited the link u mentioned ..
For more clearity lemme wrtie down what i have done..
I tried the above code with a figure plot.But to my dismay it didnt work there…can u please help me out for the same.
This is what I tried to do:
fusedData is a 4 coloumn vector..with first three corresponding to X,Y,Z coordinates and 4th coloumn for some intensity variable.I am plotting 3D plot for XYZ n..wish to display fourth variable intensity alongwith..in the display box.
%%%%%%%%CODE%%%%%%%
function displayLabelData(fusedData)
dataMat = [fusedData(:,1) fusedData(:,2) fusedData(:,3)];
intMat = [fusedData(:,4)];
h = figure,plot3(fusedData(:,1),fusedData(:,2),fusedData(:,3),’.’);
setappdata(h, ‘rangeData’, dataMat);
setappdata(h, ‘intData’, intMat);
dcm = datacursormode(ancestor(h, ‘figure’));
set(dcm,’Enable’,’on’, …
‘Updatefcn’, @dataCursorText);
function output_text = dataCursorText(obj, event_obj)
h_image = get(event_obj, ‘Target’);
pos = get(event_obj, ‘Position’);
dataMat = getappdata(h_image, ‘rangeData’);
intMat = getappdata(h_image, ‘intData’);
clicked_label = dataMat;
clicked_label_Z = intMat;
output_text = {[’X: ‘,num2str(pos(1))],[’Y: ‘,num2str(pos(2))],[’Z: ‘,num2str(pos(3))],clicked_label_Z};
%%%
please hepl its kind of urgent
Thanks in advance
Regards,
Aditya
Aditya – What have you done to try to debug your code? I suggest that you set a breakpoint in your dataCursorText function and step through. Make sure each line is doing what you expect. Making debugging suggestions is about all I can offer you; I won’t have time to work on debugging your code myself. I hope this helps.
Oh Steve..!
Man I have tried debugging it also..and also tried it using different handles for objects like gcf and all..
yet frustratively..its all in vain..I am nowhere able to transfer my specific data to datacursortext function by any means.
getappdata(h_image, ‘rangeData’);..and other getappdata functions are not returning any data i had supplied using setappdata.
I am afraid ..does figure object works differently then imshow :(
please ..revert back for the problem
Regards
aditya,
You’re calling SETAPPDATA with the handle to the figure as your first input argument, but it looks like you’re calling GETAPPDATA with the handle to your image as the first input. That’s like putting your pencil into your shirt pocket and then looking for it later on your desk. You’ll need to specify handles to the same object in your SETAPPDATA and GETAPPDATA calls.
Thanks Steve,
Unkowingly I have got my pencil back :)…by some other means,still thanks for the concern u have shown.
Thanks again & Regards,
Aditya
Steve,
is there a way 2 get coordinates of an object in a binary image so that after connecting that points u can get the original image?
Nishadi—I do not really understand your question. What do you mean by “coordinates of an object” and what do you mean by “connecting the points”?
Dear Steve,
brief description about my previos question:
suppose there is a jpeg image which has a rectangle with vertices at (20,20),(20,50),(30,20),(30,50).I need 2 read the jpeg image,store those coordinats in an array or a matrix.I tried 2 do that but after retreiving the coordinats & drawing the shape i got a zig-zag line instead of a rectangle!
Nishadi—To draw such a shape, you need an ordered traversal of boundary pixels. Use bwboundaries or bwtraceboundary.
Dear Steve,
I am using a IMperx Video Capture card to get images from an medical ultrasound machine. It brings in images. My goal is to get images in an infinite loop and set one frame as background and subtract the background from the other frames. I am using one frame per trigger and manual trigger. I notice that there is a certain (random) image jitter in vertical screen direction that I can’t figure out. Here is part of my code that displays the frames. Would it help if I use snapshot? or take more frames per trigger and average the images? I appreciate your suggestion and help.
vid=videoinput(‘winvideo’);
handles.vid=vid;
set(handles.vid,’FramesPerTrigger’,1);
set(handles.vid,’TriggerRepeat’,Inf);
triggerconfig(handles.vid,’Manual’);
start(handles.vid);
guidata(hobject,handles);
handles.background=defaultimage;
handles.imag=defaultimage;
while 1
trigger(handles.vid);
if (handles.getbackground,’UserData’)
handles.bakground=getdata(handles.vid,1,’unit8’);
else
handles.imag=getdata(handles.vid,1,’unit8’);
endif
suntracted_image=imlincomb(1.,handles.imag,-1.,handles.background);
end
Steve,
I am new in MatLab and as a physician I have always been interested to write some codes. The question above, is related to the ultrasound image capture for real patients and helping us direct needles into prostate gland for cancer detection and treatment. In my last post (above) I did not know that I should not include code lines. Please post your suggestion as it may help save a lot of time and effort from my side. Basically how do I get rid of image jitter in vertical direction? I am just wondering if I am doing something wrong in my frame capture process. Thank you for your help.
Nasser—I suggest you contact tech support. They have information that can help diagnose problems that may be related to acquisition issues.
Hi there :) My name is Alfian. I have a lebeled BW. The thing I want to do now is to draw a rectangle for each of the BoundigBoxes of the labeled components… I have looked the the post above saying something about ConvexImage and ConvexArea? Can you please explain how? Thanks a million Steve
Hi steve,
Hi I am Angel, a PhD student. I started using Matab a few days before and having a lot of problems in working. For two days I am stuck with a particular (may be very simple) problem. if we have a set of values (a 1000*192 matrix), can we save it as a picture and then work on it instead of loading image as such. I can see the data as image using ‘image(filename)’, but donno how to save it as an image. kindly help.
Many thanks, Angel
Alfian—Use regionprops to get the bounding box for each object. From the bounding box, construct x and y vectors to draw the rectangle shape, and then use hold on and plot to superimpose the shape on top of your image.
Angel—Use imwrite.
Hi Steve. Thanks a lot!!!
I used just that and it solved my problem.
I have an additional question btw :) It is a bit off topic… but hopefully you would be able to help me.
I am actually working on OCR in images/video frames. I have managed to get the candidate text areas…
The main problem now is trying to get the (square) text regions binarized. By asking this question, I think you can tell that I am a newbie in matlab :P
I tried the im2bw… I also tried some thresholds (graythresh and also manually entered values). I also tried Otsu.m (which I downloaded somewhere)… but that was worse because it made everything white (maybe I dont understand the Otsu concept yet…).
Was wondering if you could perhaps point me in the right direction? I know to ask for a binarization algo would be over the top :)
Anyway… thanks in advance
Regards: Alfian
Alfian—graythresh uses Otsu’s method. What problem did you have with it?
I tried using graythresh. and it worked. I actually downloaded a code somewhere (otsu.m) if not mistaken. And dint know how to use it. But after reading again about graythresh, i got it :)
anyway, thanks Steve! :)
Alfian—I’m glad to hear that it worked for you.
Hello steve, I have a question regarding labeling objects.
Do the labelled objects refer to objects which are white in the binary image? Because i have this image which when converted to binary results in the objects being black and the background being white and thus when i use the funtion
[label,numobj] = bwlabel(image,4), the number of objects returned refers to the white background. How can i determine the number of black objects?
Mj—Yes, the Image Processing Toolbox uses the convention that, in binary images, white pixels (one-valued pixels) are foreground. You can determine the number of black objects by complementing the image (use the ~ operator) before calling bwlabel.
Hi Steve. Can I display strings as data cursor text? This may be a slightly different problem- I have an image already labeled by specific regions of interest (ie- I have all the nickels as value 5, and the dimes as 10) Can I get the cursor to display ‘nickels’ when the cursor is on that region?
Jeff—Sure. See the documentation for customizing data cursor text in this online doc section.
Hello steve;
my question is about “Labeling labeled objects file”.
I try to use your suggested program , so i use display_label_matrix.m which contain:
[code deleted - SE]
so, when i execute display_label_matrix program, i obtain error in the last figure(8) if i click to their objects : "error in custom datatip string function"
I can't find the cause of error,and how to correct it?, please, give me your help.
thanks in advance.
Salem—I can’t make specific suggestions on your code, but I can make a general debugging suggestion. Set a breakpoint in your custom datatip string function and then single-step through it to find the source of the error.
Hi steve,
thanks for your help.
Now, i display each object centroid in my image (in total i have 19 centroids corresponding to 19 regions)as:
[Ld,numd] = bwlabel(image)
cgd=regionprops(Ld,’Centroid’);
figure(7),imshow(image),
hold on
for k = 1:numel(cgd)
c = cgd(k).Centroid;
text(c(1), c(2), sprintf(‘%d’, k), …
‘Color’, ‘b’, …
‘FontWeight’, ‘bold’,…
‘HorizontalAlignment’, ‘center’, …
‘VerticalAlignment’, ‘middle’);
end
hold off
After some traitement, i want to display only some valid regions in image ( regions centroid number four , seven and ten).so, i win to put in matrix number of valid region m=[4;7;10].
my question is : how can i display only regions centroid which numbers are given in m?.
thanks in advance.
Salem—Index into the output of regionprops to get just the measurements for the objects you want. For example:
Hi steve. I don’t know if this is the correct thread to post this question, but i think I’ll just give it a go.
I have an image of a soccer field (far view, with players on the field, and also visible audience at the stands).
I have managed to extract the field color… and the result of that is a binary image, with the field region as white, and other regions as black (hence the players and the audience becomes black). But at the same time, there are some noise… where some non field regions are not turned to black. This is due to the weakness and non-robustness of my field extraction algo.
I want to check for the size of each player on the field. Hence, I used regionprops to get the biggest convexImage, which I regard as the field region (because all the ‘noise’ regions are smaller… ). If I display back the convexImage, the result is as you know, a rectangular figure… the field at times is at an angle, depending on how the camera captured the frame… so I end up with the field region, and also some black non-field regions (maybe at the right or left corners of the figure).
My question is… since I want to calculate only the size of players within the field (hence, within the convexImage), is there a way whereby I can only isolate the procesing within the white pixel area of the convex image? And exlcude processing of black pixels outside the white pixel area?
I hope you get what I mean :P Sorry if you are confused.
PS:- I thought of using the convex hull coordinates… but i dont quite understand how to…
I think… a better way to put it… I just want to detect the blobs within the convex image parameter… :) thanks
Sorry.. i think I meant to spell “perimeter”… sorry for 3 consecutive posts. English is not my mother tongue…
Alfian—No need to apologize for a typo, and I think your English is great!
Regarding non-field regions not being turned to black – try using bwareaopen, with a fairly big threshold value, to eliminate small objects outside the true field. Then you might want to use imclose with a rectangular structuring element to further “clean up” the field image. You can use imclearborder with the complement of the field image to remove black non-field regions at the corners of the image.
Then use a logical AND operator (&) with your field image and the player image. This should eliminate the players outside the field. Then use bwlabel and regionprops on the result.
Hi Steve,
Sorry for the late reply. Thanks for your suggestion. I will try it :) Will inform you of the result insya-Allaah when I am done.
Thanks again :D
i want to draw a box around an object in an image…
in the example given above only how can i draw boxes for each object present in the image..
someone please write me a code for this..
thanks in advance
Sunil—You can use regionprops to get the bounding box for objects in your binary image. Then you can use hold on and plot to superimpose rectangles on the image. You’ll need to write the code yourself.
Hi there steve. I have a question for you based on bwlabel.
I have a gray image containing 2 circular disks and some background noise. I have tried to clean my image up and then i converted to a black and white image and filled in the holes. Now I have 2 circular disks, which i was hoping for but i also have various white images throughout the background.
When I use bwlabel, it seems to be picking this noise up as objects and labeling them. I used your display_label_matrix and this seems to be what it is doing. How do I reject everything but my 2 circular disks?
By the way, i am using bwlabel as my end goal is to find the diameters of my circles. I am hoping to use the “diameter” m file from your book. is this the action you advise?
Thanks in advance for your help.
A very greatful Lee
Lee—Try bwareaopen for eliminating the noise, and try using the MajorAxisLength property returned by regionprops to estimate the circle diameters.
That worked very well. Thank you steve!
I now have to calculate diameters for overlapping circles. Does this make the issue more difficult?
Thanks again
Lee
Hi Steve,
Is there a way of writing the results from the datacursor back to a variable in the M file?
For example, letting the user click n times, write out the n datacursor positions to a variable, and then continuing executing of the m file with the obtained positions.
thanks!
Maurits
Lee—Yes, that makes the problem significantly more difficult. You’ll need to find some appropriate segmentation method. Watershed segmentation might work – see the toolbox demos for an example. But then the MajorAxisLength measurement from regionprops won’t be a good estimate of the circle diameters, because it’ll be based on fitting a partial circle. You might be able to use the diameter function from the book.
Thanks Steve.
Ill try the watershed + diameter function and let you know how it goes.
Thanks again.
Lee
Maurits—It is certainly possible to write out information from within the dataCursorText function. You may be able to combine this with the waitfor function to achieve the effect of having your code wait for some condition that gets set by the dataCursorText function. It will take some programming.
Steve, when will the 2nd edition of your book be available? Thanks, Jon
Jon—I’m not sure how long the printing and distribution process is going to take this time around. I think it may be available early spring, but I’m not certain.
Hello Steve,
I came across this blog post while searching for a way to determine the centroid of an object in an image. I’m not sure how relevant my question will be to this post, but here it goes: I’m trying to determine the center of mass of an object in an image by clicking out the object’s outline, computing the area of the polygon made by this outline, and then computing the object’s 2D center of mass. My latest effort at this involve using “impoly” to click out the outline of the object. However, I’m unsure as to how I can retrieve the vertices of the polygon (in, say, a matrix). The only way I’m able to retrieve them is by right clicking on the polygon I just created, selecting “Copy” from the context menu, and pasting the coordinates in a text file. Do you happen to know of a cleaner (and perhaps more efficient) way to retrieve the polygon’s vertices coordinates without having to right click the polygon?
Thank you for you time and expertise.
David
David—If you call impoly with an output argument, it will return an object that has a getPosition method.
Dear all
I have some photos take with my camera and I want to add text on them.
The procedure was
- imshow
- text
- print -djpeg90
But, there is one issue, the photos are much larger than my screen’s resolution so they were shown scaled. Then, when I saved them, the size of the resulted image was the small one.
Is there any way to overcome this issue?
Can I create a second image with the text only (but in large size).
I thank you in advance
Vassilis
Vassilis—Use the -r option with the print function to control the output resolution. You can also use the print function to print a figure that has only text in it.
Hi steve,
as per your lebeling labled object example as you extracted the 8′th object(coin) from labeled image .can you plz tell me how to get this extracted image in the original format..
as per your example i want the final image containing only the object but the image should looks as original image.so what operations to be perform on original image and that labled image to get the final image. i’m new to image processing.i don’t know how to tell u this in exact word . plz help me on this
actually i tried this on mammographic image in this i have to segment that image ,only breast area is to required in output image for futher processing
in mammographic images some artefacts like lables are present that are to be removed by using thresholding and labeling and the breast region is extracted.and the final segmented image contains only breast region.sequence of output images like original image -binary image-extracted labled region-final image having breast region only .this image is of original image format only area other than breast is removed.
plz…..reply…me
Shirure—Use regionprops to get the BoundingBox property of the object of interest. That will tell you the rows and columns for the object. Then use normal MATLAB indexing to extract the corresponding subarray from the original image array.
hello steve,
I have read abt ur bwlabel tutorials, personalised and applied em, works fine but now i am having a lil problem.
based on ur ‘alphabet labeling using bwlabel’ tutorial, i did something similar but now i want to like constrict a square box around an object (lets say object 1) the problem is the code is unable to recognise from background and foreground objects in doing so and i tried to invert the pixel 1′s->0′s and 0′s->1′s but no avail here is the code: can u please help? ^^
Long code fragment deleted. -SE
Kevin—Sorry, but I can’t help you with debugging your code. You might to look at Loren’s latest blog post for debugging tips. Use the MATLAB ~ operator to convert 1s to 0s and 0s to 1s.
ok no problem sir..
but i cant seem to find this info anywhere: bwlabel seems to label white objects out of black, can this be inverted? inverting the bw –> 1s to 0s and 0s to 1s still bwlabel labels white parts. is that an unchangeable default?
i tried debugging but am getting a headache lol so i start from scratch – plz assist me in this query:
is there an inbuilt function where i can isolate/constrict a labeled object (labeled using bwlabel and regionprops)? if not then how can i code it?
sory if i am unclear – lets take the coin example above.. lets say i want to isolate object 2 and store only object 2 with the x and y axes limited to 1pixel above,below,to-the-right,to-the-left of the object in question, in an array.. How to do this?
I GOT IT!!!!! haha cant tell u how happy i am!!! was just a question of where to put the ~
omg… matlab is the best hehe
Kevin—Glad you figured it out. All Image Processing Toolbox functions that work on binary images assume that 0-valued pixels are the background. To extract a single object, use the ‘Image’ option in regionprops.
oh i see thx a lot for those precious tips Steve… ^^
Dear Steve
first I should thank to you for your great work ;-)
and my question is if I want to know total pixel value of each coin and lable them then what should I do?
Best regards
Alis
I missed:total pixel value for the coins at grayscale image(coins.png)
Best regards
Alis
Alis—Use the 'PixelValues' option of the function regionprops.
Steve,
this data cursor is great! I was trying to use bwboundaries to digitize some polygons from a scanned geological map. This worked quite well and I was going to use the result as a mask to parse coordinates from the matrices weith X and Y coordinates. But I was not sure if points in the boundary were stored as consecutive pixels or by row,columns from top left corner to bottom right. This helped me confirm points are stored as consecutive pixels. Thank you.
Matteo
Matteo—Glad it helped. As you discovered, bwboundaries does indeed trace boundaries by following consecutive pixels.