Several readers commented on my recent roipoly and poly2mask posts, and I wanted to follow up on a couple of issues they raised. The first issue is a common point of confusion about the selection of rectangular regions, and the second is how to access and modify pixels contained within a region of interest.
Contents
Rectangular regions
Users sometimes wonder why poly2mask and roipoly don't return some of the boundary pixels of a rectangular region as part of the mask. Here's an example.
x = [2 4 4 2 2]; y = [2 2 4 4 2]; mask = poly2mask(x, y, 5, 5)
mask =
0 0 0 0 0
0 0 0 0 0
0 0 1 1 0
0 0 1 1 0
0 0 0 0 0
Some users expect rows 2 through 4 and columns 2 through 4 to be included in the mask. One reader commented that he uses a different function instead of roipoly because of this behavior.
As I have illustrated in my previous posts, roipoly and poly2mask treat a pixel not as a point, but as a unit square area. The upper-left corner of the (2,2) pixel is (1.5,1.5), and the lower-right corner is (2.5,2.5). So the polygon defined by the x-y vertices in the example above covers only one-fourth of the (2,2) pixel.
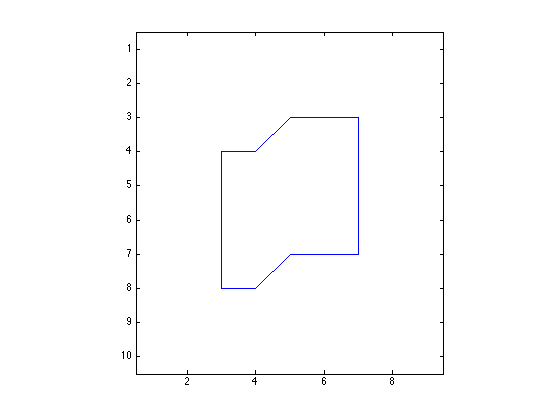
I suggest that you get used to defining rectangles that cover complete pixel areas. Such rectangles go along pixel edges, not through pixel centers. Here's a second example to demonstrate:
xp = [1.5 4.5 4.5 1.5 1.5]; yp = [1.5 1.5 4.5 4.5 1.5]; maskp = poly2mask(xp, yp, 5, 5)
maskp =
0 0 0 0 0
0 1 1 1 0
0 1 1 1 0
0 1 1 1 0
0 0 0 0 0
Now the "mystery" is completely removed about which border rows and columns are in the mask. There's no need to use some other function.
Logical indexing
Another reader asked how to get and modify pixels inside a region of interest. One nice way to do that in MATLAB is to use logical indexing. The expression A(B), if B is logical and the same size as A, selects all the elements in A corresponding to the true elements of B.
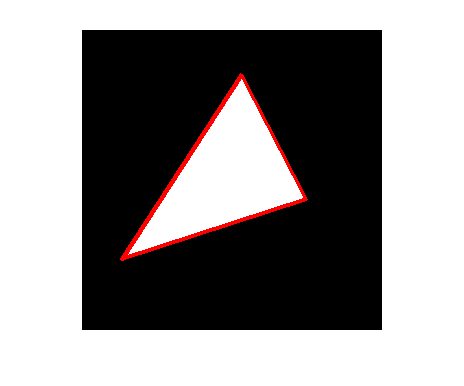
I'll demonstrate using an example mask from the roipoly documentation.
clear
I = imread('eight.tif');
imshow(I)
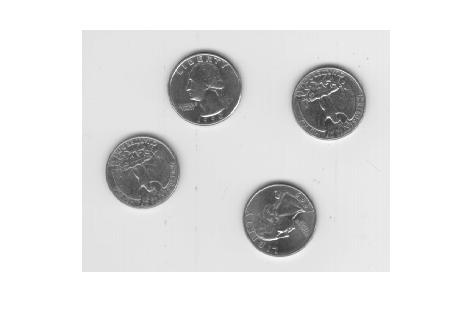
c = [222 272 300 270 221 194]; r = [21 21 75 121 121 75]; mask = roipoly(I,c,r); imshow(mask)
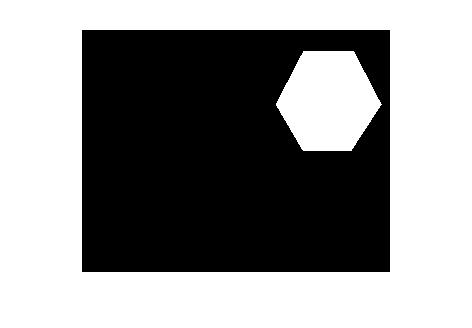
If you use whos or look in the workspace browser, you can see that mask is a logical matrix.
whos
Name Size Bytes Class Attributes I 242x308 74536 uint8 c 1x6 48 double mask 242x308 74536 logical r 1x6 48 double
The expression I(mask) is a column vector containing all the elements of I corresponding to the true values of mask. Here, for example, is how you would compute the mean of the pixels inside the region of interest:
mean(I(mask))
ans = 156.0468
You can use logical indexing on the left-hand side of an assignment as well.
I2 = I;
I2(mask) = 255 - I(mask); % Or imcomplement(I(mask)).
imshow(I2)
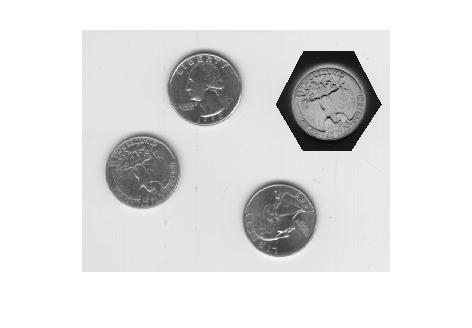
Here's a documentation link for logical indexing. Or you might be interested in this MATLAB Digest article that Loren and I wrote about MATLAB indexing.
Get
the MATLAB code
Published with MATLAB® 7.3


Thank you. :)
thank you som uch. it is very informative and useful.
Thank you! But how to decompose the mask to make it work with the decomposed image??
Andy—What’s a decomposed image?
I want to create a mask which contains a ROI.Just like things in JPEG2000,how to create a mask with a given region of interest.the mask should contain all the coefficents in every subband in the wavelet domain.
thank u!
Andy—A mask is just a binary image. The set of nonzero pixels in the mask defines the region of interest. You can create the mask however you like.
Respected Sir
I have gone through above said matlab based commend line. I thiunk its based on only two dimentional image. But how can I made the things for medical (3-D) images.Please give your suggestion.
With warm regards from
SYED ABDAHEER
Syed—For a logical indexing expression A(D), D has to match the size of A. If you have a 2-D logical mask and are working with 3-D data, then you either have to replicate the mask along the third dimension, or you have to work with the data one plane at a time.
Nice explanation, thank you.
if the ROI is a rectangle (axis not verticle), and if we wish to see it in a verticle rectanglular box by using imshow, how to proceed?
how to assign this extracted rectangular ROI to another vertical rectangle? since the indices of mask follow lower to higher column values, not according to the directions of the polygon to be extracted.
Subama—I don’t understand your question.
Hi, Steve,
I am very thankful for your nice explanation. I would like to ask you a question. when we use roipoly and then figure pops up. After that we have option to select region of interest by selecting vertices on figure by mouse. The question is what I should to to save the part of image which I select by mouse.
Thank you so much for your time and consideration.
I am sorry. I mean how I can exract and save the part of image which I select by mouse.
Ilyas—The post you commented on explains how to use the mask returned by roipoly to extract the image pixel values that are inside the polygon. If you have a truecolor (M-by-N-by-3) image, though, you’ll need to use separate logical indexing expressions for each color component, like this:
Is there a way to use roipoly to allow the user to draw a polygon on a figure that contains a plot but not an image? My goal is to allow the user to draw a polygon on a scatter plot and to then return the coordinates of the plotted points that lie within the polygon. I have been able to do this using impoly.m, but most of my current work uses matlab 7.4.0 (r2007a), and the image toolbox associated with this version of matlab does not seem to include impoly. So I would like to implement this without impoly but have not succeeded. Any suggestion would be appreciated. Thanks.
Jon—Make your own copy of roipoly and edit it so that it doesn’t call poly2mask at the end.
thanks steve. working now.
ROIPOLY — How to display the image in color?
Steve,
When I am using roipoly(img) to interactively select ROI, it often occurs to me that if the displayed image is colorful instead of grayscale, it will make my life much easier, as colorful pictures show more visual depths than black-and-white ones. Do you have any way of doing this, for instance, by using a colormap?
Thank you.
Willow
Willow—You have a few options:
Steve,
I am trying to use bwboundaries+regionprops to create a mask of user-specified objects. I have a step where the user clicks on his objects of interest (these will remain as part of the final mask) and another step where the user can click-draw polygons on the figure to add/remove parts of the image.
The problem is, the points returned upon userclicks and “boundary” (B{k} from [B,L]=bwboundaries(I)) are integers and aren’t specified in the way that you mentioned in your discussion about rectangular regions. So when I try to visualize the mask, the image/mask is missing some of the boundary regions.
I could try to fiddle with the coordinates (look for it’s corners/edges and increase/decrease their values by 0.5, but I am wondering if Matlab has some built-in functionality that would allow me to get around this issue in a quicker fashion.
Thanks for your help,
-Justin
I can get around part of the issue by using the ‘Image’ option from regionprops, but i am still stuck when it comes to the user-selecting of points part.
I want to user to be able to click and connect the edges of a polygon which will then be used to increase/decrease the size of the initial mask. (cut out or restore based on the drawn shape & location)
As a separate question (and i’m probably missing something really simple here), but in your first example, how come you don’t see a result like”:
mask =
0 0 0 0 0
0 0 0 0 0
0 0 1 0 0
0 0 0 0 0
0 0 0 0 0
Shouldn’t the way the coordinates are defined also mean that only 1/4th of pixel (4,4) is covered too?
-Justin
Justin—I don’t exactly understand how you are using bwboundaries in your application, but I’ll try to give some partial but hopefully useful advice. First, you might find bwselect useful for the part where users click on objects to select them. Regarding your comment #21: If the rules were defined the way you suggest, you could tile the image plan completely with rectangular polygons that were each 2 units wide and 2 units high, and only 1/4 of the image pixels would be considered to belong inside ANY of the polygons, despite the fact that the polygons cover the plane. If you want to understand the details of why the ROIPOLY rules are defined the way they are, take a look at my ROIPOLY and POLY2MASK series (part 1, part 2, part 3).
So I suggest you take a look at bwselect and the ROIPOLY series, and then come back here and ask more questions if needed.
I have been trying to define a polygon using roipoly() because I have an irregular shaped object (a foot) that i want to make a patch for in my robot model. I have an image of the foot stored as jpg and I need this as a patch in matlab. I have discovered now though the roipoly() returns a mask, not what I want. What i need is the verticies stored as x and y data that i can send to the patch command.
IS it possible to get these values from roipoly()? Or is there some other function out there that will capture my clicks as vertices?
cheers
Alex
Alex—Check out the last couple of syntaxes in the roipoly doc. These syntaxes return the polygon vertices. Or you could try using impoly.
Hi Steve,
This was very useful.
Say I want to draw a square in an image and analyze all the pixels within the square. As you said, defining a mask and then using indexing I can get all the pixels within the square. Since the mask is binary, when I do image overlay of the mask on the original image, it appears as a white square.
Apart from the analysis of the pixels within the square over time, I would also like to display just the boundary of the square (and not the white mask) in the original image (or movie). I can then show how things are changing within the square (as the movie is running).
Hi Steve,
I have one more question regarding roipoly.
Is it possible to use roipoly to define an ellipse and then get the integrated intensity of all the pixels within the ellipse ?
I tried using imellipse, but I did not know how to proceed with the function handle that I get using imellipse.
Thanks