 Cleve’s Corner: Cleve Moler on Mathematics and Computing
 The MATLAB Blog
 Guy on Simulink
 MATLAB Community
 Artificial Intelligence
 Developer Zone
 Stuart’s MATLAB Videos
 Behind the Headlines
 File Exchange Pick of the Week
 Hans on IoT
 Student Lounge
 MATLAB ユーザーコミュニティー
 Startups, Accelerators, & Entrepreneurs
 Autonomous Systems
 Quantitative Finance
 MATLAB Graphics and App Building
Upslope area – More plateau processing
In part 4 of this series I classified DEM plateaus into:
- Max plateaus
- Min plateaus
- Mid plateaus
In part 5 I outlined the possibility of using roifill to modify plateau pixels.
Today I'll combine these ideas with a little morphological processing to compute pixel flow directions for all DEM pixels, except for isolated ones in the center of the min plateaus.
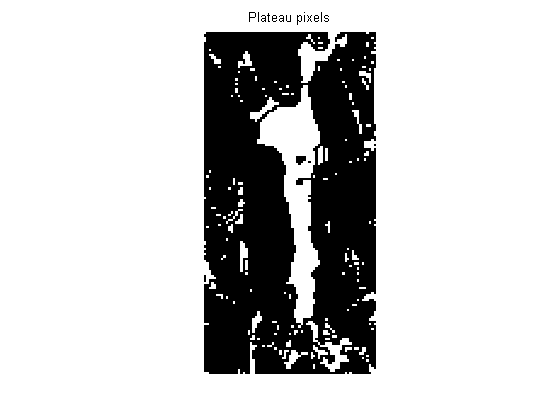
First, find all the plateau pixels that have no downhill neighbors. Remember that we can find these using erosion:
s = load('upslope_sample_dem');
pond = s.Zm(140:280, 160:230);
plateaus = imerode(pond, ones(3,3)) == pond;

imshow(plateaus, 'initialmag', 'fit')
title('Plateau pixels')
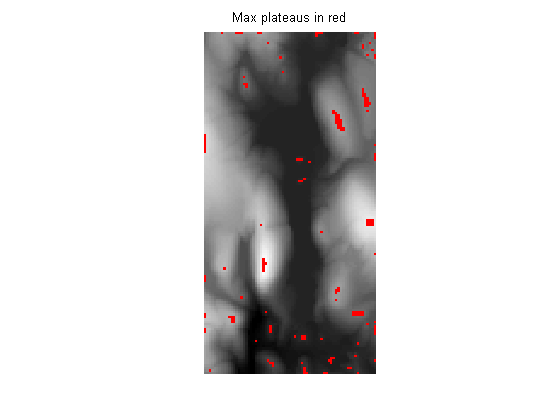
Next, find the max plateaus using imregionalmax:
max_plateaus = imregionalmax(pond);
One way to visualize plateau pixels is to overlay them on the original image using another color. Use imoverlay, a utility function I wrote last year. (See my March 28, 2006 post for details.)
vis1 = imoverlay(mat2gray(pond), max_plateaus, [1 0 0]);
imshow(vis1, 'initialmag', 'fit')
title('Max plateaus in red')
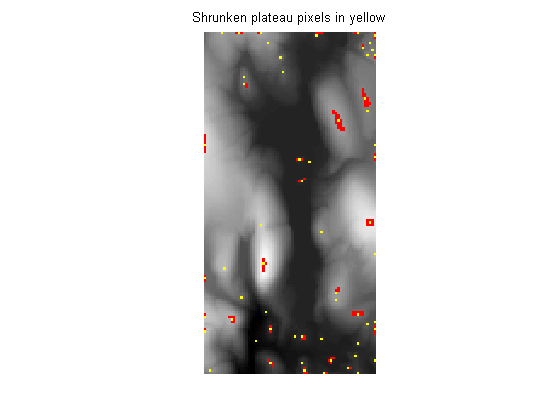
The bwmorph shrink operation reduces connected components to single points (or, for objects with holes, to a ring).
max_plateaus_shrunk = bwmorph(max_plateaus, 'shrink', Inf);

vis2 = imoverlay(vis1, max_plateaus_shrunk, [1 1 0]);
imshow(vis2, 'initialmag', 'fit')
title('Shrunken plateau pixels in yellow')
Bump the shrunken plateau pixels to an elevation slightly above their neighbors. We'll bump up by a fixed constant here. To make a completely general version we'll probably have to calculate the bump based on eps and the maximum plateau height.
pond2 = pond;
pond2(max_plateaus_shrunk) = pond(max_plateaus_shrunk) + 0.1;
Now let's do the same thing to the min plateaus, except that we'll slightly lower the shrunken plateau pixels.
min_plateaus = imregionalmin(pond);
min_plateaus_shrunk = bwmorph(min_plateaus, 'shrink', Inf);
pond2(min_plateaus_shrunk) = pond2(min_plateaus_shrunk) - 0.1;
As I described in part 5, I would like to use roifill here to interpolate the plateau pixels. However, the logic of roifill doesn't quite work out right. Specifically, when you pass in a mask to roifill, it only fills in the interior pixels of the mask. You can see this in the code:
dbtype roifill 68:74
68    % Find the perimeter pixels of the specified region; these will
69    % be used to form the boundary conditions for the soap film PDE.
70    perimeter = bwperim(mask);
71
72    % Find the interior pixels; these are the pixels that will be
73    % replaced in the output image.
74    interior = mask & ~perimeter;
For this application I want to fill all the pixels specified by the mask. So I'll do what MATLAB users often do: I'll take an existing M-file and modify it to suit my needs. Starting with roifill, I created a new M-file called regionfill. In the new function, mask specifies the pixels to be filled, and the boundary pixels are computed from the mask by dilation instead of by using bwperim:
dbtype regionfill 27:29
27    % Find the N, E, S, and W pixels adjacent to the pixels to be filled. These
28    % will be used to form the boundary conditions for the soap film PDE.
29    perimeter = imdilate(mask, [0 1 0; 1 1 1; 0 1 0]) & ~mask;
Now I can use regionfill to interpolate the plateau pixels. But not all the plateau pixels. We don't want to fill those that got bumped higher or lower. When those bumped pixels get used by regionfill as boundary conditions, they'll help eliminate the other plateau pixels.
mask = plateaus & ~max_plateaus_shrunk & ~min_plateaus_shrunk;

pond2 = regionfill(pond2, mask);
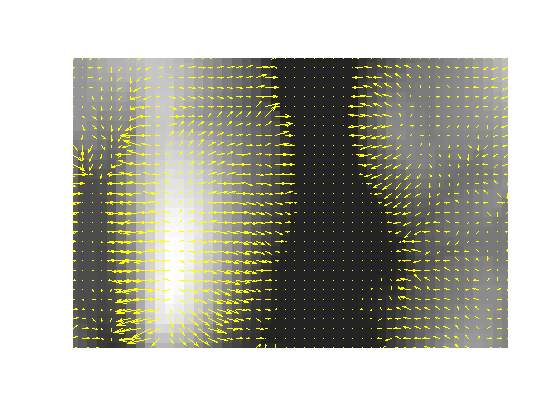
Using both the original DEM (pond) and the modified DEM (pond2), we can now compute pixel flow for every pixel. We use the modified DEM only for plateau pixels (see the last two paragraphs of part 5 for an explanation).
[M,N] = size(pond);
r = zeros(M-2, N-2);
s = zeros(M-2, N-2);
for i = 1:M-2
    for j = 1:N-2
        [r(i,j), s(i,j)] = pixelFlow(pond,i+1,j+1);
        if isnan(r(i,j))
            % Plateau pixel; use the modified DEM.
            [r(i,j), s(i,j)] = pixelFlow(pond2,i+1,j+1);
        end
    end
end
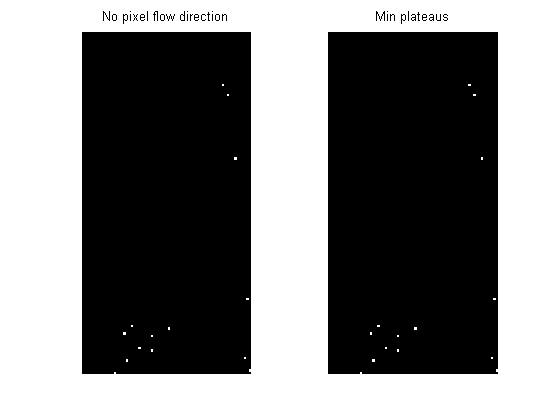
As the images below show, this procedure has successfully computed pixel flow directions for all pixels except those belonging to the shrunken min plateaus.
subplot(1,2,1)
imshow(isnan(r))
title('No pixel flow direction')

subplot(1,2,2)
imshow(min_plateaus_shrunk(2:end-1,2:end-1))
title('Min plateaus')
Next time I'll start looking at the actual upslope area computation.
- Category:
- Upslope area


Comments
To leave a comment, please click here to sign in to your MathWorks Account or create a new one.