 Cleve’s Corner: Cleve Moler on Mathematics and Computing
 The MATLAB Blog
 Guy on Simulink
 MATLAB Community
 Artificial Intelligence
 Developer Zone
 Stuart’s MATLAB Videos
 Behind the Headlines
 File Exchange Pick of the Week
 Hans on IoT
 Student Lounge
 MATLAB ユーザーコミュニティー
 Startups, Accelerators, & Entrepreneurs
 Autonomous Systems
 Quantitative Finance
 MATLAB Graphics and App Building
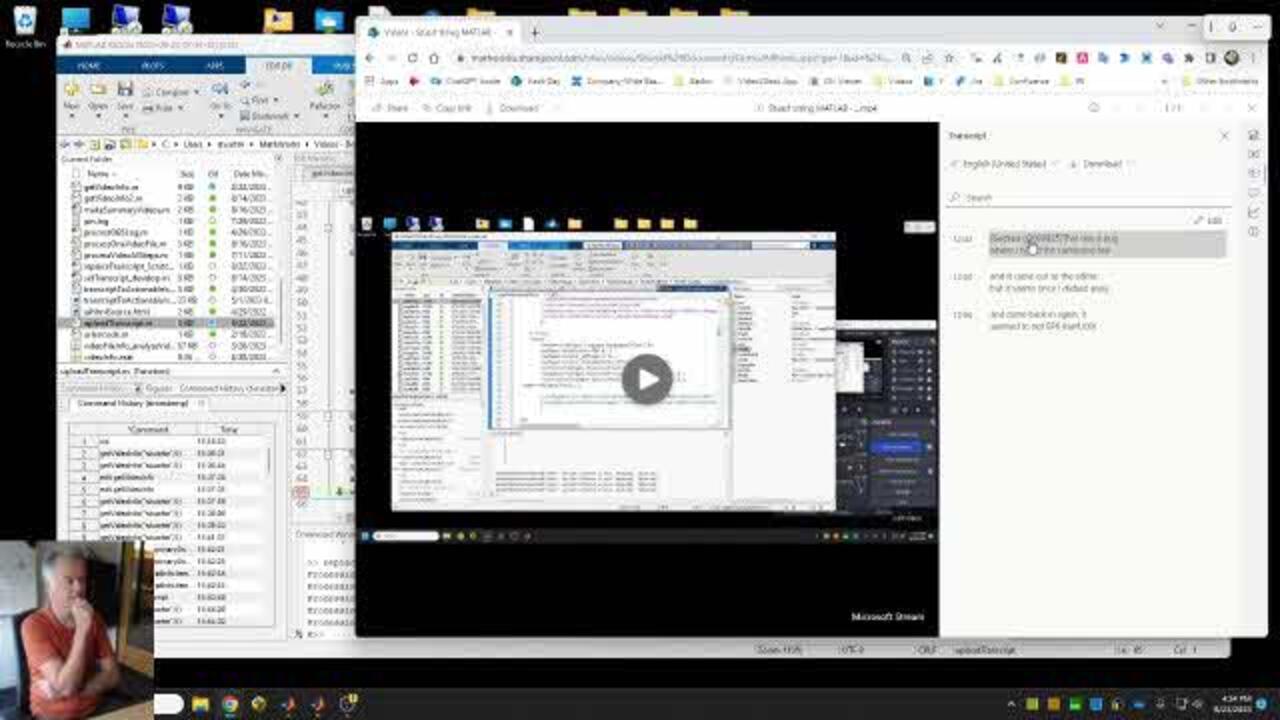
I need to be able to download the audio transcript of an existing Microsoft SharePoint video, modify it and re-upload it. I already have a few functions and components that will help me do this. I… read more >>
I need to be able to download the audio transcript of an existing Microsoft SharePoint video, modify it and re-upload it. I already have a few functions and components that will help me do this. I… read more >>

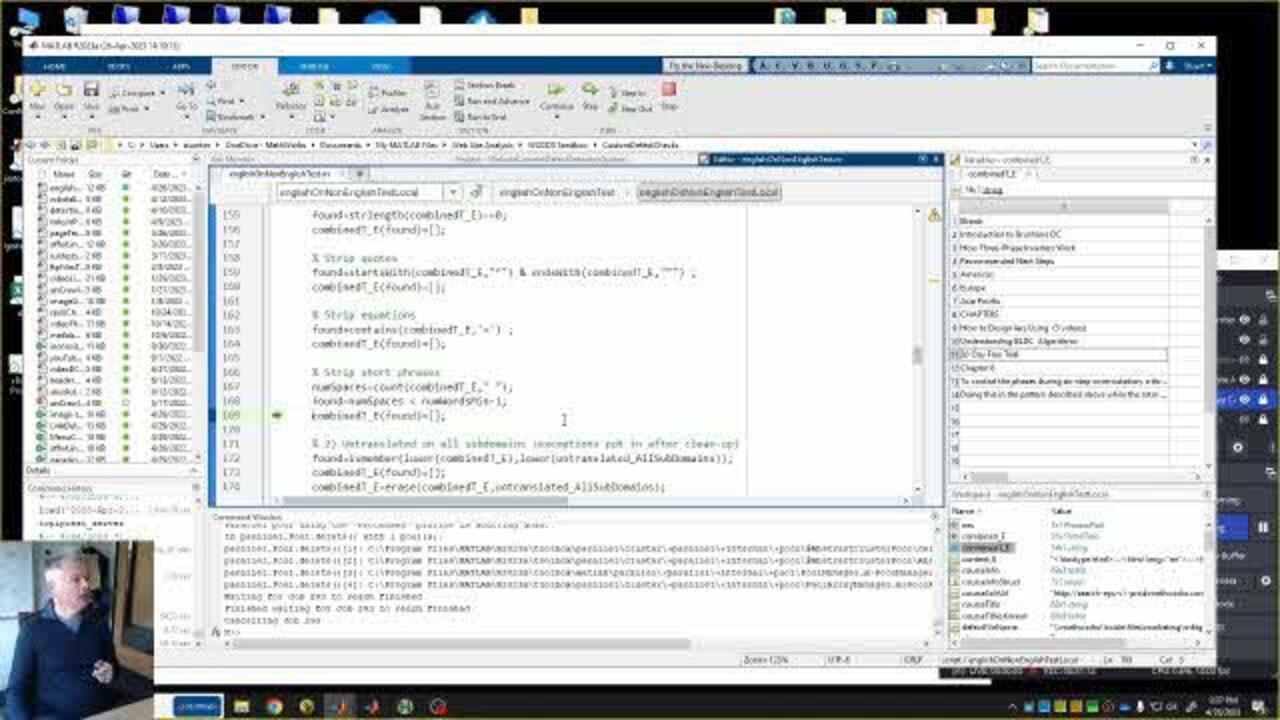
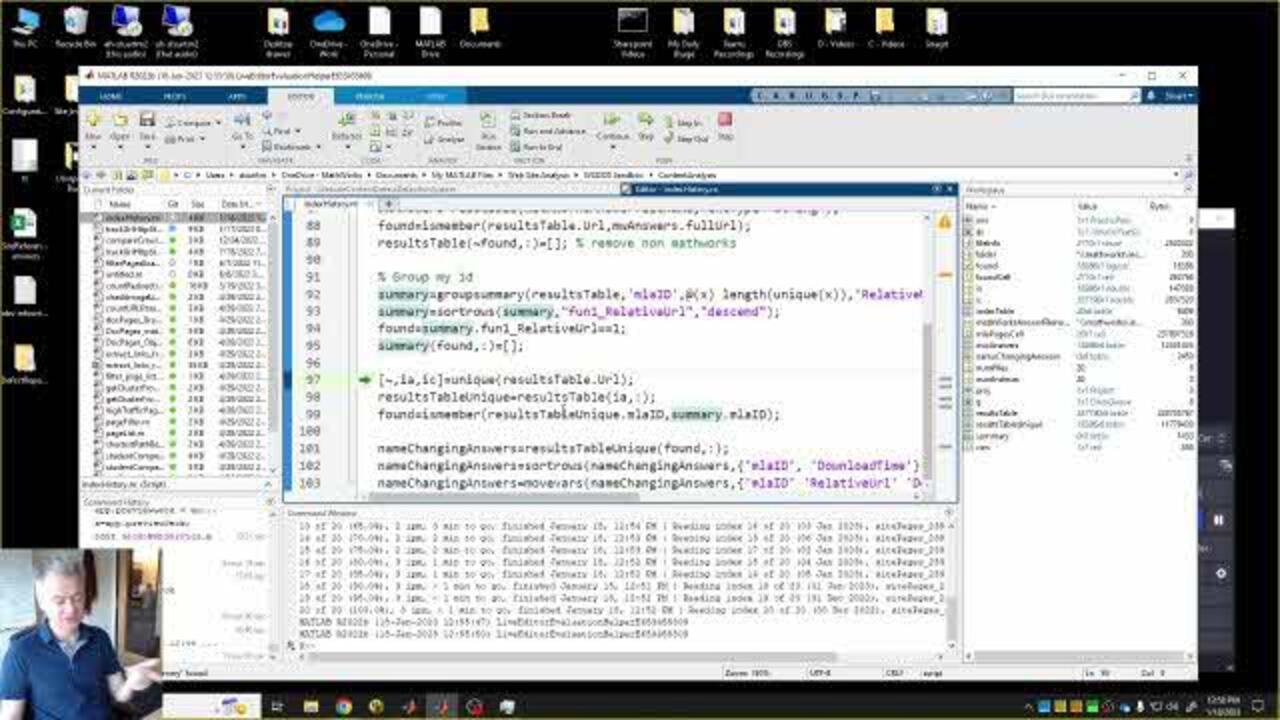
I have a bug in my script which removes an element of a string array unexpectedly. So I plan to watch the contents in the variable editor as I step through my code each line at a time, to help me… read more >>
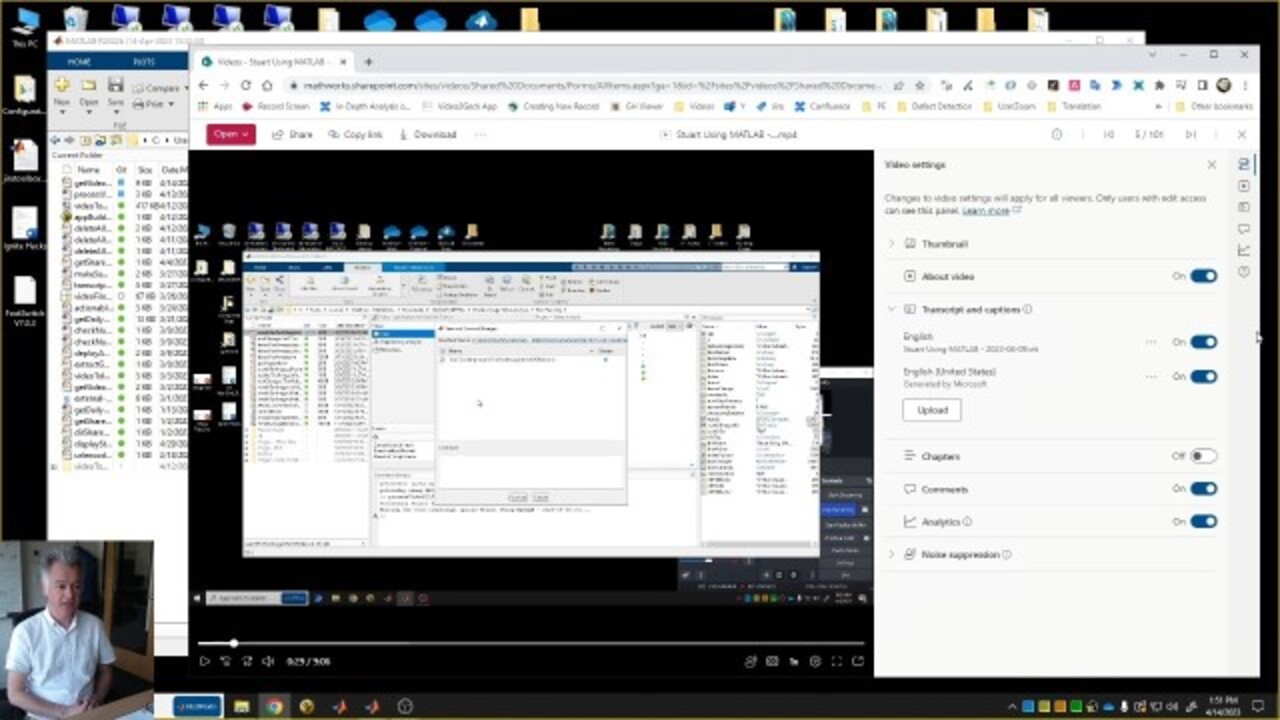
Here I want to upload a time-stamped caption file to a SharePoint video using their REST API. This will let me navigate and browse interesting events in the video. I’m going to use the same… read more >>
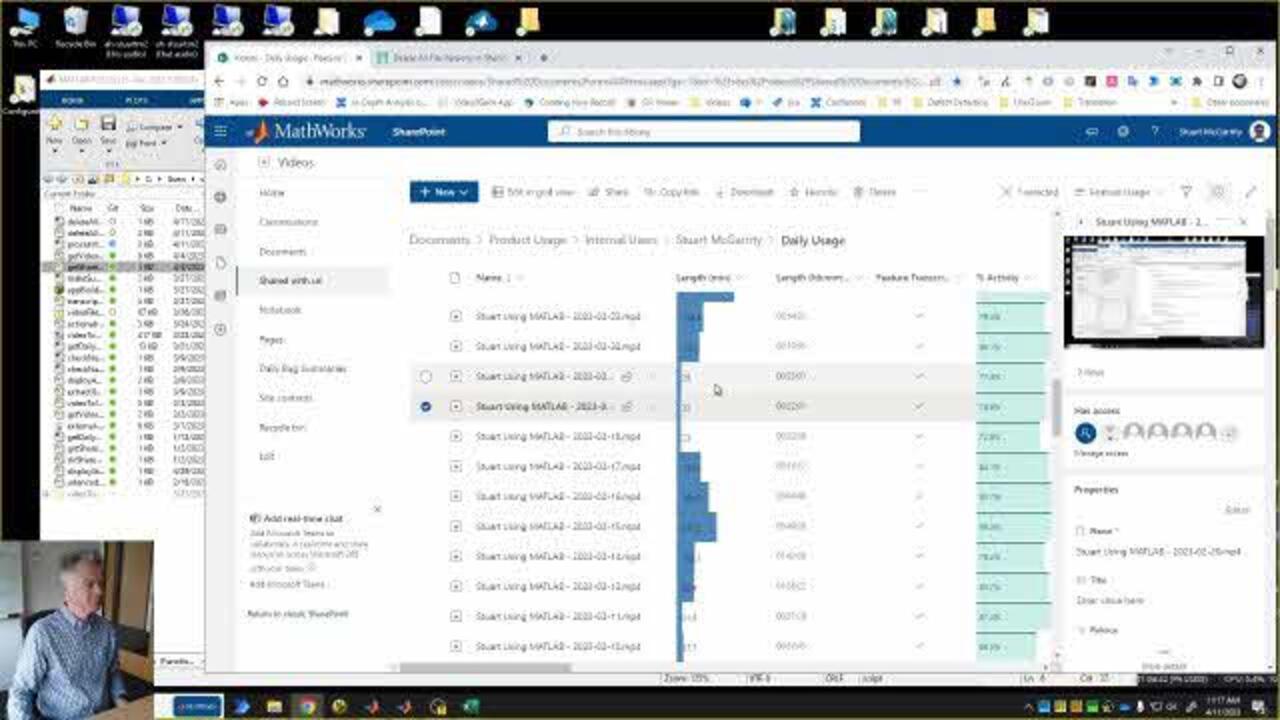
In my last post, I developed a script to delete the past versions of a SharePoint file using the REST API. Now, I want to delete past versions of all the files in a folder. I think I’ll start… read more >>
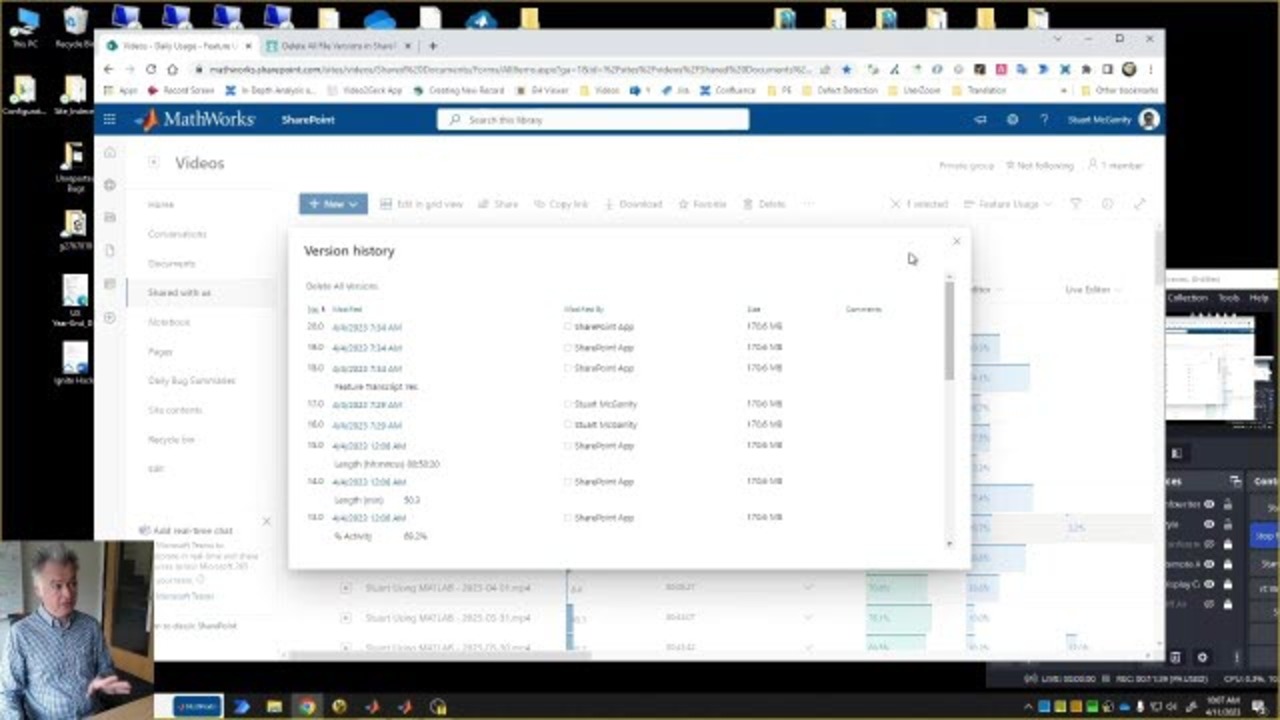
I need to delete all the past versions of a set of files on SharePoint because they are taking up too much space. I’m going to try and use the SharePoint RESTful API to do this, which I have… read more >>
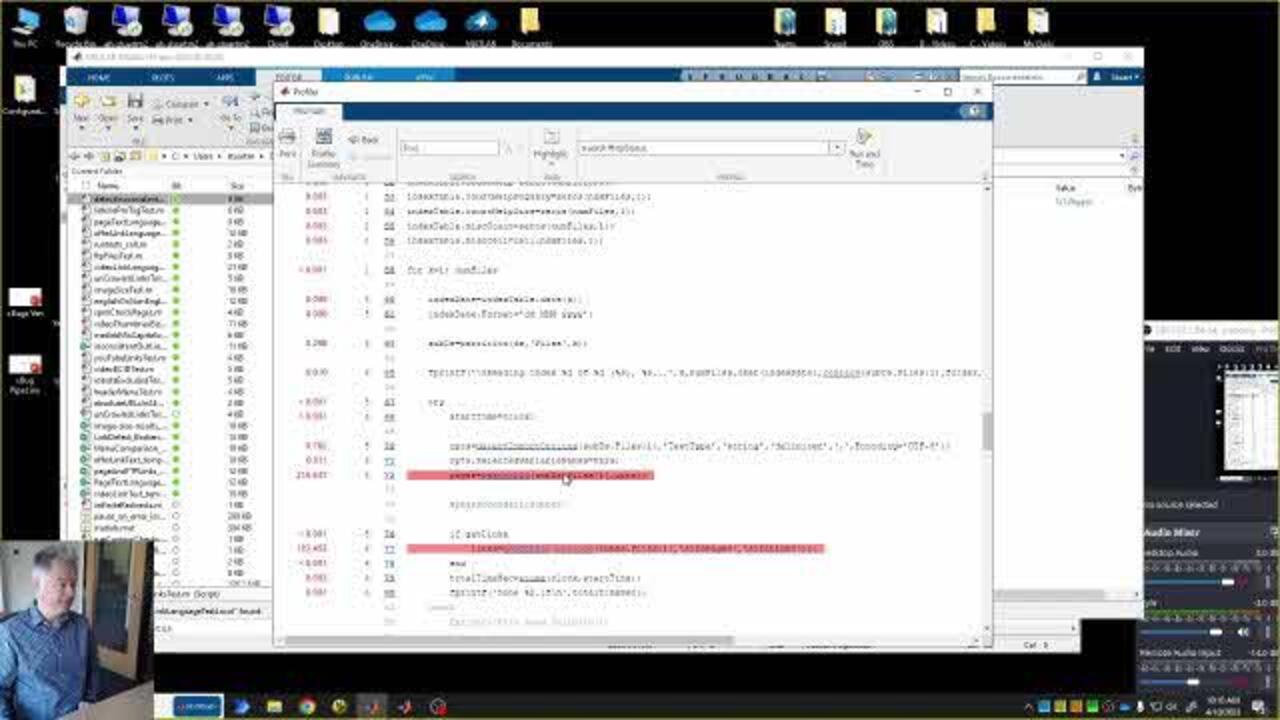
This video uses a different recording style from my others. Rather than recording continuously while I work, I pause recording when my code changes are taking a long time to execute or I have some… read more >>
You many not be aware that you can debug the code contained inside a section (marked by %%) without needing to run your entire file. This can be useful when you are working on a small area of code,… read more >>
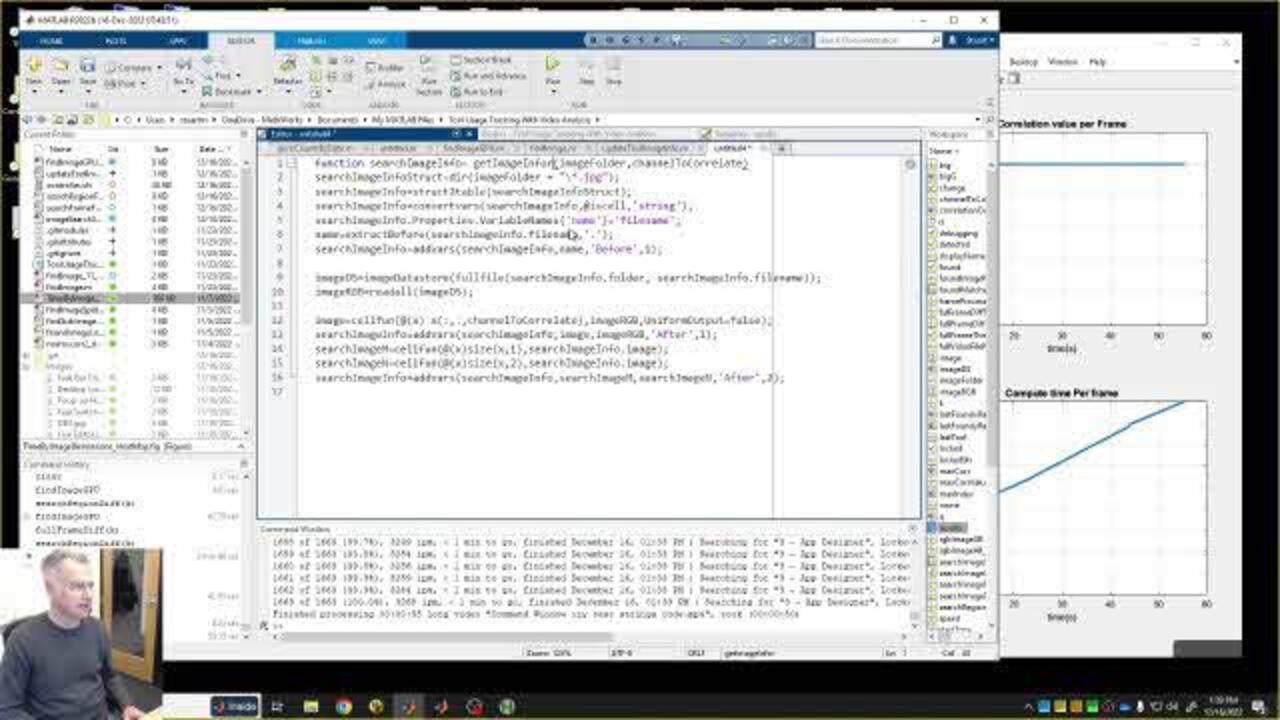
Here I want to modularize and re-use part of my code by converting it to a function, but in this case the automatic conversion in the editor is not supported, so I need to do it manually.
Features… read more >>
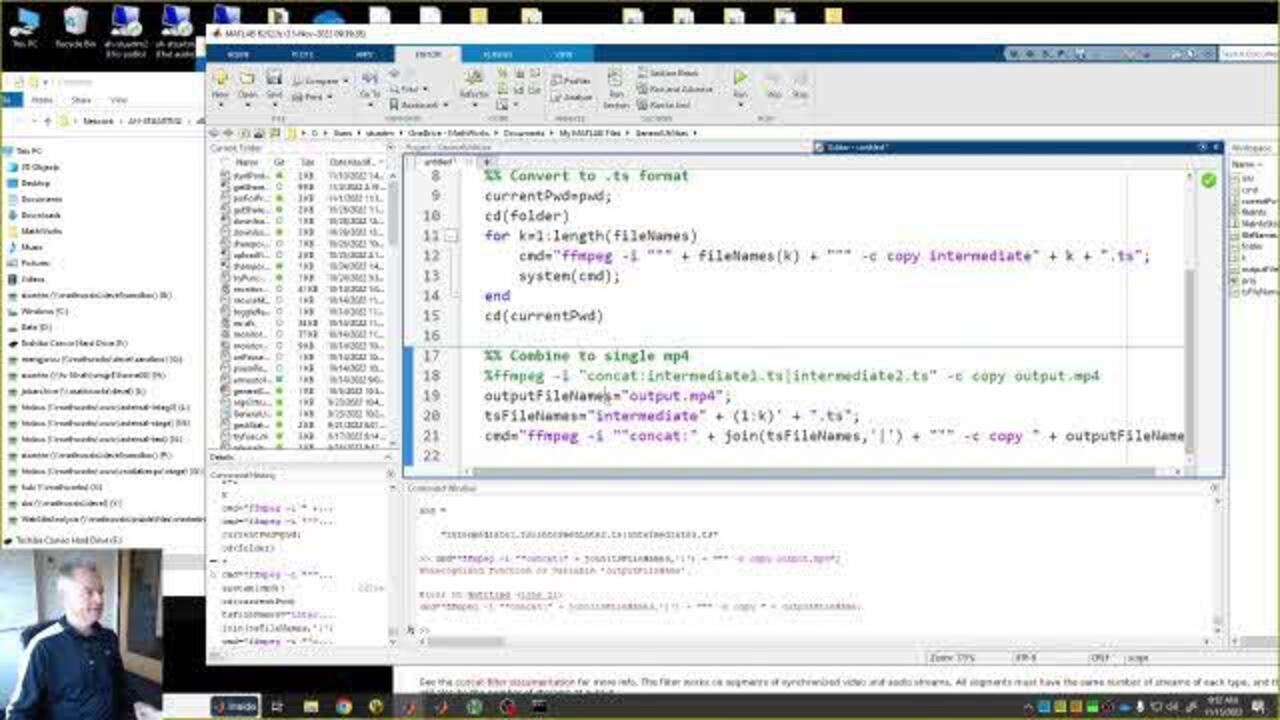
I often need to call external command line tools from MATLAB to carry out various specialized tasks. Here I plan to make a utility that calls the FFmpeg tool to concatenate video files.
Features… read more >>
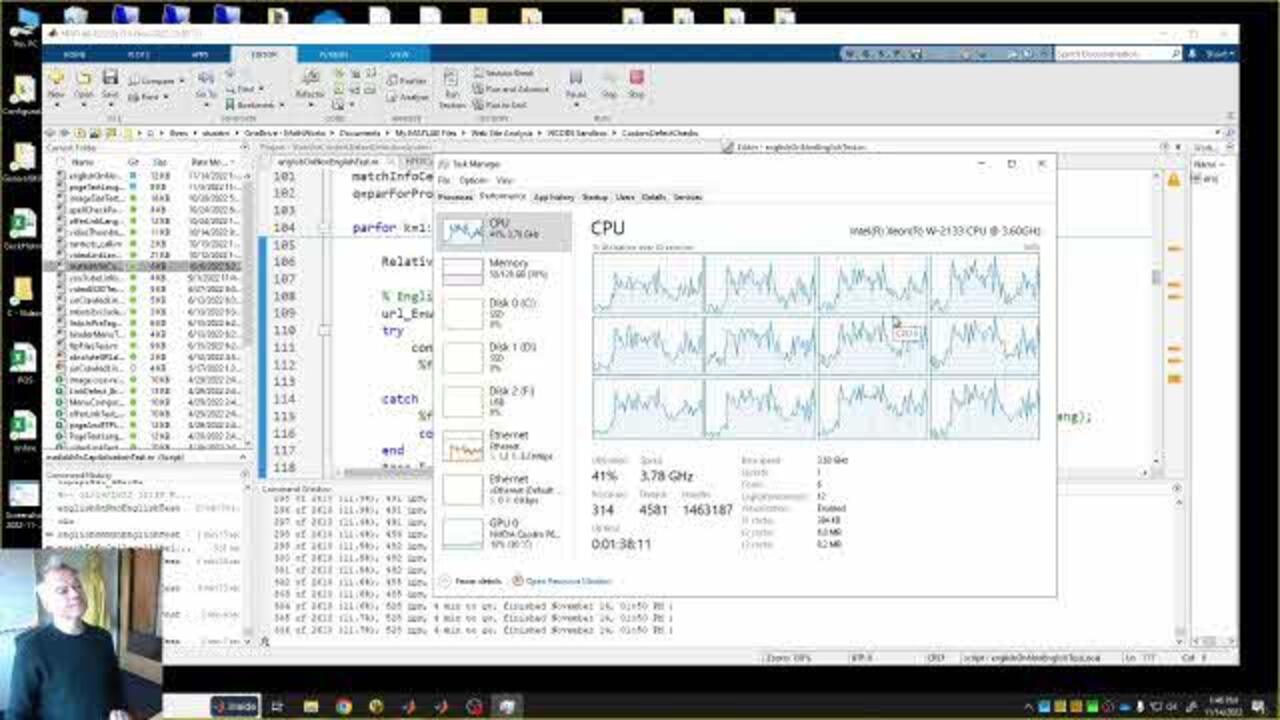
I’m trying to parallelize a script that takes a few hours to run. I normally use parfor, the simplest parallel construct, but to do that, I need to modify how I index through my… read more >>
These postings are the author's and don't necessarily represent the opinions of MathWorks.