 Cleve’s Corner: Cleve Moler on Mathematics and Computing
 The MATLAB Blog
 Guy on Simulink
 MATLAB Community
 Artificial Intelligence
 Developer Zone
 Stuart’s MATLAB Videos
 Behind the Headlines
 File Exchange Pick of the Week
 Hans on IoT
 Student Lounge
 MATLAB ユーザーコミュニティー
 Startups, Accelerators, & Entrepreneurs
 Autonomous Systems
 Quantitative Finance
 MATLAB Graphics and App Building
Plotting multiple Y scales
Often times, people want to plot two vectors of data with the same x-axis, but the vectors are at wildly different values on the y-axis. The vector with the smaller y values will often be just a flat line if you use the same scale for both. For that reason, things like plotyy were invented.
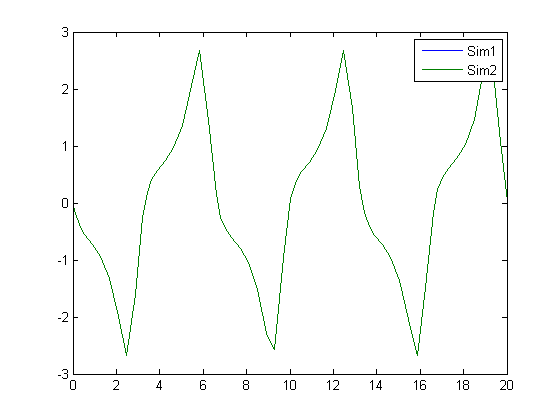
Zhipeng was not satisfied with our implementation, so he made his own with LayerPlot. Compare the difference!


댓글
댓글을 남기려면 링크 를 클릭하여 MathWorks 계정에 로그인하거나 계정을 새로 만드십시오.