 Cleve’s Corner: Cleve Moler on Mathematics and Computing
 The MATLAB Blog
 Guy on Simulink
 MATLAB Community
 Artificial Intelligence
 Developer Zone
 Stuart’s MATLAB Videos
 Behind the Headlines
 File Exchange Pick of the Week
 Hans on IoT
 Student Lounge
 MATLAB ユーザーコミュニティー
 Startups, Accelerators, & Entrepreneurs
 Autonomous Systems
 Quantitative Finance
 MATLAB Graphics and App Building
Shading plots for emphasis
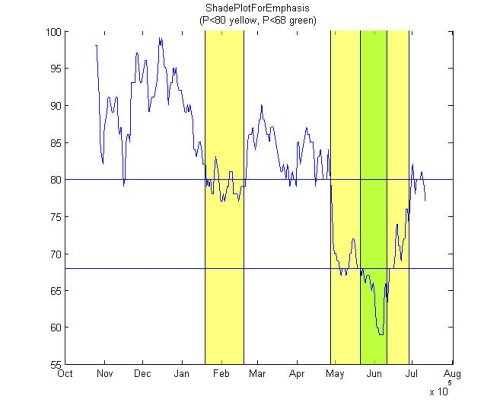
Sometimes showing the data in a plot is just not enough. You need to be able to emphasize the parts that are the most important for the viewer of the plot. ShadePlotForEmphasis will do just that.
I like that this function comes with useful help, and a demo and that Michael kept the syntax very concise:
G={today-[30 51]};

ShadePlotForEmpahsis(G,'g',0.5);


评论
要发表评论,请点击 此处 登录到您的 MathWorks 帐户或创建一个新帐户。