Displaying Structures
Jiro's pick this week is ANY2CSV by Felix Zoergiebel.
I use structures quite often. It allows me to store heterogeneous information in one variable, and I can have structures within structures as well. Sometimes, I go crazy and make many levels of hierarchy to organize my information.
Let's take a look at this data.
load data
whos
Name Size Bytes Class Attributes a 4x1 2704 struct
This is a structure that contains information from a series of stress tests. I can dig into the structure to see its contents...
a(1)
ans =
     TestName: 'Stress Test One'
    Condition: 'fast'
         Test: [2x1 struct]
a(1).Test(1)
ans =
     Date: 'May 3'
    Score: 89
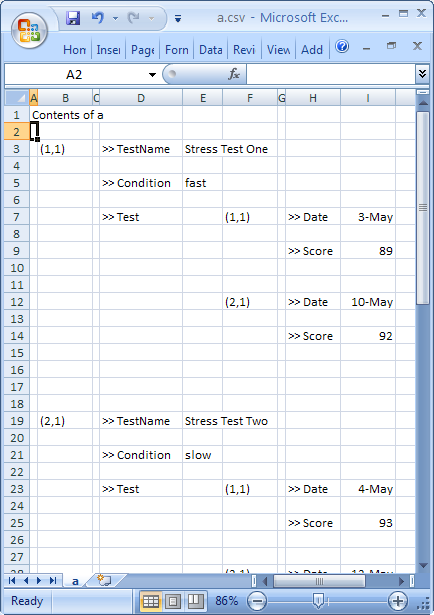
But sometimes, I just want to view everything at once. ANY2CSV allows you to do just that. It flattens the structure and either displays it on the screen or saves it as a CSV file.
any2csv(a, ',', 0, 'a.csv');
Now, I have a summary of the data stored in the structure.

Very nice! I also want to thank Felix for his quick response to my enhancement request. I asked him whether the fields of the structure could be displayed vertically, rather than horizontally, and he updated the submission in a timely manner.
Comments?
Data visualizations don't always come in the form of graphs. We'd love to hear about other interesting ways of viewing information. Tell us about it here.
- カテゴリ:
- Picks
 Cleve’s Corner: Cleve Moler on Mathematics and Computing
 The MATLAB Blog
 Guy on Simulink
 MATLAB Community
 Artificial Intelligence
 Developer Zone
 Stuart’s MATLAB Videos
 Behind the Headlines
 File Exchange Pick of the Week
 Hans on IoT
 Student Lounge
 MATLAB ユーザーコミュニティー
 Startups, Accelerators, & Entrepreneurs
 Autonomous Systems
 Quantitative Finance
 MATLAB Graphics and App Building


コメント
コメントを残すには、ここ をクリックして MathWorks アカウントにサインインするか新しい MathWorks アカウントを作成します。