How to customize the Simulink Scope!
 By Guy Rouleau
As we all know, there is a tool for each job. You can hit a nail with a screwdriver, but the job is easier with a hammer. It’s the same thing to display Simulink data. One common question I receive in technical support is how to customize the Simulink Scope. My answer to this question is simple: Do not customize the Simulink Scope… use simplot.
With simplot, you can easily take the data from a Simulink Scope that looks like this:

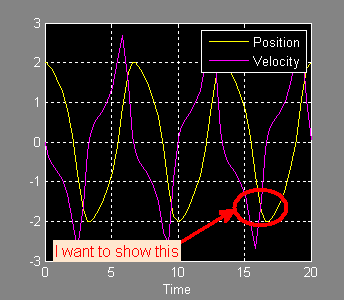
And create a MATLAB figure with annotations, legend and labels.

The Simulink Scope is an optimized display designed to run fast during simulation. Its job is to show signals while the simulation is running. For post-simulation analysis, creating reports and presentations, a MATLAB figure is more appropriate. The simplot function helps by plotting simulation data in a MATLAB figure that looks like the Simulink Scope.
To plot the output of a Simulink model in a MATLAB figure, the first step is to save the data to the MATLAB workspace using one of these 3 options:
- The “Save Data to Workspace” option of Simulink Scopes
- To Workspace blocks
- Root-level Outport blocks
To create the figure above, I saved the output of a Scope block to the variable ScopeData:

After simulating the model, I used simplot to create the figure:
simplot(ScopeData)
legend('Position','Velocity')
annotation('ellipse',[0.68  0.25  0.15  0.12],...
    'EdgeColor','red',...
    'LineWidth',3);
annotation('textarrow',[.5 .68],[.2 .3],...
    'TextEdgeColor','none',...
    'TextLineWidth',3,...
    'TextBackgroundColor',[1 .9 .8],...
    'FontSize',12,...
    'Color','red',...
    'LineWidth',3,...
    'String','I want to show this');
Now it's your turn
How do you visualize the data coming out of your simulations?
 Cleve’s Corner: Cleve Moler on Mathematics and Computing
 The MATLAB Blog
 Guy on Simulink
 MATLAB Community
 Artificial Intelligence
 Developer Zone
 Stuart’s MATLAB Videos
 Behind the Headlines
 File Exchange Pick of the Week
 Hans on IoT
 Student Lounge
 MATLAB ユーザーコミュニティー
 Startups, Accelerators, & Entrepreneurs
 Autonomous Systems
 Quantitative Finance
 MATLAB Graphics and App Building


评论
要发表评论,请点击 此处 登录到您的 MathWorks 帐户或创建一个新帐户。