Loading Signals in Timetable Format
Today I decided to revisit a topic I covered a few years ago: loading discrete signals in a simulation.
Let's see what has been added in the last few years to help with the potential problems you might run into when loading discrete signals in a simulation.
The Problem
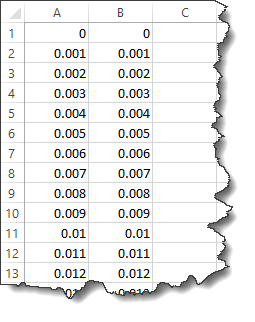
Let's start with a simple Excel sheet with two columns, the first one for time and the second for the signal values. I made the data identical to the time just to make the issue more obvious. The actual file we will use contains 10,000 rows, for a stop time of 10 seconds.

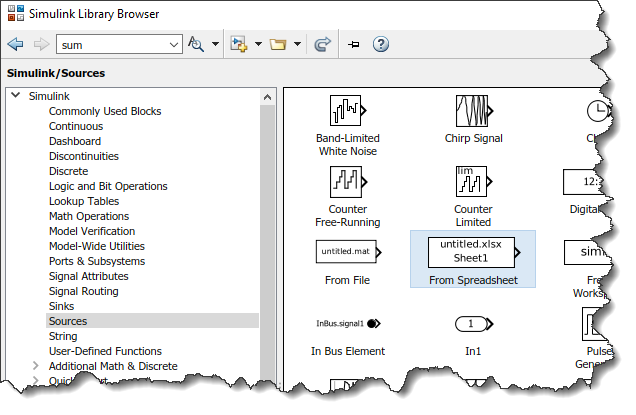
As I explained in this post, it is possible to use the From Spreadsheet block to load this signal.
If you do so, I strongly recommend to be careful and NOT load the time column from Excel. Even though the time points in Excel might look equally spaced, they might not be equally spaced in the same way as Simulink time steps. If there is a discrepancy, you might end up with duplicated or missing points.
For the file shown above, here is what the output looks like if you use the default settings in the From Spreadsheet block. The spikes on the bottom axis are indications that points are missed or duplicated.

See this post for more details on how to configure the From Spreadsheet block to avoid this issue.
For today's example, I am adding an additional level of complexity:
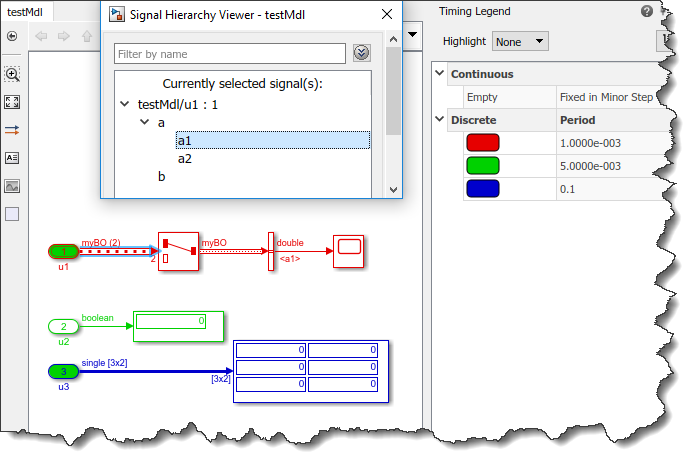
- I want to load the signal through a root-level Inport block
- I want the signal to be part of an array of buses
- I want the model to have multiple root-level Inport blocks at different rates
Using the following model, we want to load the signal from the Excel sheet and assign it to element "a.a1" of Inport "u1":

createInputDataset
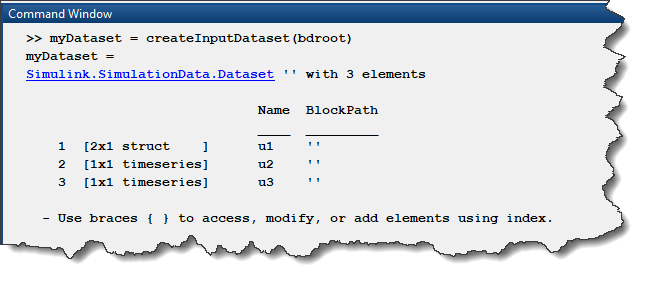
When you have a model like that for which you want to load signals through root-level Inport blocks, your best place to start is the function createInputDataset.
This function will analyze your model and create a skeleton dataset object that fits your model.

In this dataset, each signal is a MATLAB timeseries with one point at the simulation start time and one point at the stop time, both with a value of zero. All we need to do now is replace those with our real data.
Timetable
At this point, we could read the Excel file and create a time series with the first column as time and the second column as data:

However, we end up with the same problem as above... since the time column in Excel is not identical to the steps taken by Simulink, we still see a few missed points:

Fortunately, instead of a timeseries, it is possible to fill the dataset with a timetable. Instead of xlsread, it is possible to read the data directly using readtimetable, which is more modern and powerful.
In the following example, I also used timetable to specify other signals with different sample times.

Simulating the model, we can confirm that no point is missing or duplicated:

Now it's your turn
What is your preferred way to load signals in a simulation? Let us know in the comments below.
- カテゴリ:
- Signals,
- Simulink Tips
 Cleve’s Corner: Cleve Moler on Mathematics and Computing
 The MATLAB Blog
 Guy on Simulink
 MATLAB Community
 Artificial Intelligence
 Developer Zone
 Stuart’s MATLAB Videos
 Behind the Headlines
 File Exchange Pick of the Week
 Hans on IoT
 Student Lounge
 MATLAB ユーザーコミュニティー
 Startups, Accelerators, & Entrepreneurs
 Autonomous Systems
 Quantitative Finance
 MATLAB Graphics and App Building


コメント
コメントを残すには、ここ をクリックして MathWorks アカウントにサインインするか新しい MathWorks アカウントを作成します。