 Cleve’s Corner: Cleve Moler on Mathematics and Computing
 The MATLAB Blog
 Guy on Simulink
 MATLAB Community
 Artificial Intelligence
 Developer Zone
 Stuart’s MATLAB Videos
 Behind the Headlines
 File Exchange Pick of the Week
 Hans on IoT
 Student Lounge
 MATLAB ユーザーコミュニティー
 Startups, Accelerators, & Entrepreneurs
 Autonomous Systems
 Quantitative Finance
 MATLAB Graphics and App Building
Making Color Spectrum Plots – Part 3
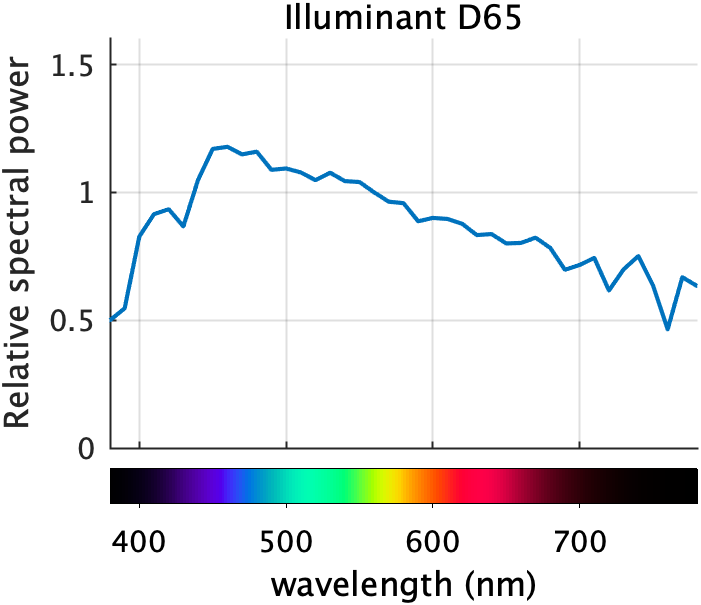
Recently, I've been explaining how I made this plot, which is from DIPUM3E (Digital Image Processing Using MATLAB, 3rd ed.):
In my July 20 post, I showed one way to compute the spectral colors to display below the x-axis. Today I'll finish up by explaining the use of the colorbar function. These techniques are used in the DIPUM3E functions spectrumBar and spectrumColors, which are available to you in MATLAB Color Tools on the File Exchange and on GitHub. The entire set of DIPUM3E functions is also on GitHub.
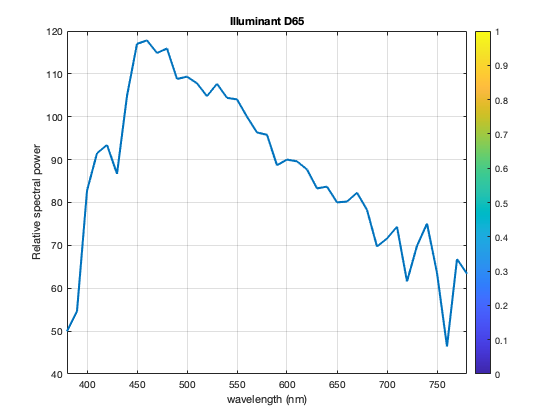
Let's just start with a plot and a colorbar with the default settings.
T = illuminant("D65");
plot(T.lambda,T.S)
xlabel('wavelength (nm)')
ylabel('Relative spectral power')
title('Illuminant D65')
grid on
xlim([380 780])
cb = colorbar
cb =

  ColorBar with properties:

    Location: 'eastoutside'
      Limits: [0 1]
    FontSize: 9
    Position: [0.8482 0.1095 0.0286 0.8167]
       Units: 'normalized'

  Use GET to show all properties
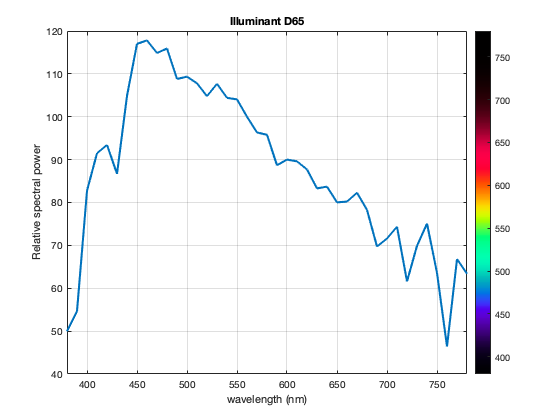
Well, let's fix the colors first. The colorbar automatically picks up its colors from the axes Colormap property, if it is set, or from the figure Colormap property. I'll set it on the axes. I also need to set the CLim property to establish the relationship between the colormap colors and the spectrum wavelength values.
[colors,lambda] = spectrumColors;
ax = gca;
ax.Colormap = colors;
ax.CLim = [min(lambda) max(lambda)];
Now let's get it in the right place.
cb.Location = 'southoutside';
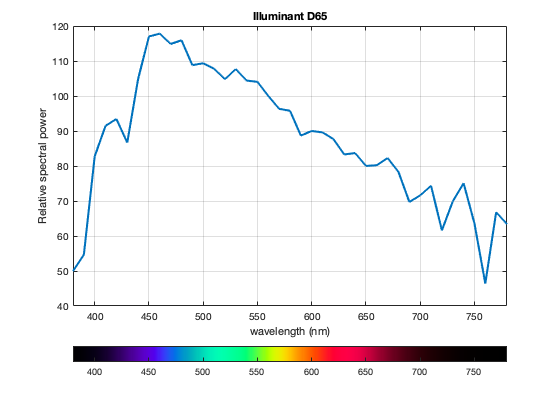
The final tweaks set things up so that the x-axis labels appear under the colorbar.
cb.Ticks = ax.XTick;
cb.Label.String = ax.XLabel.String;
cb.TickDirection = "out";
ax.XTickLabels = [];
ax.XLabel = [];

There you go. This nontraditional use of colorbar works pretty well as an auxiliary color label for the x-axis (or y-axis). If you find another use for this technique, let us know in the comments.


댓글
댓글을 남기려면 링크 를 클릭하여 MathWorks 계정에 로그인하거나 계정을 새로 만드십시오.