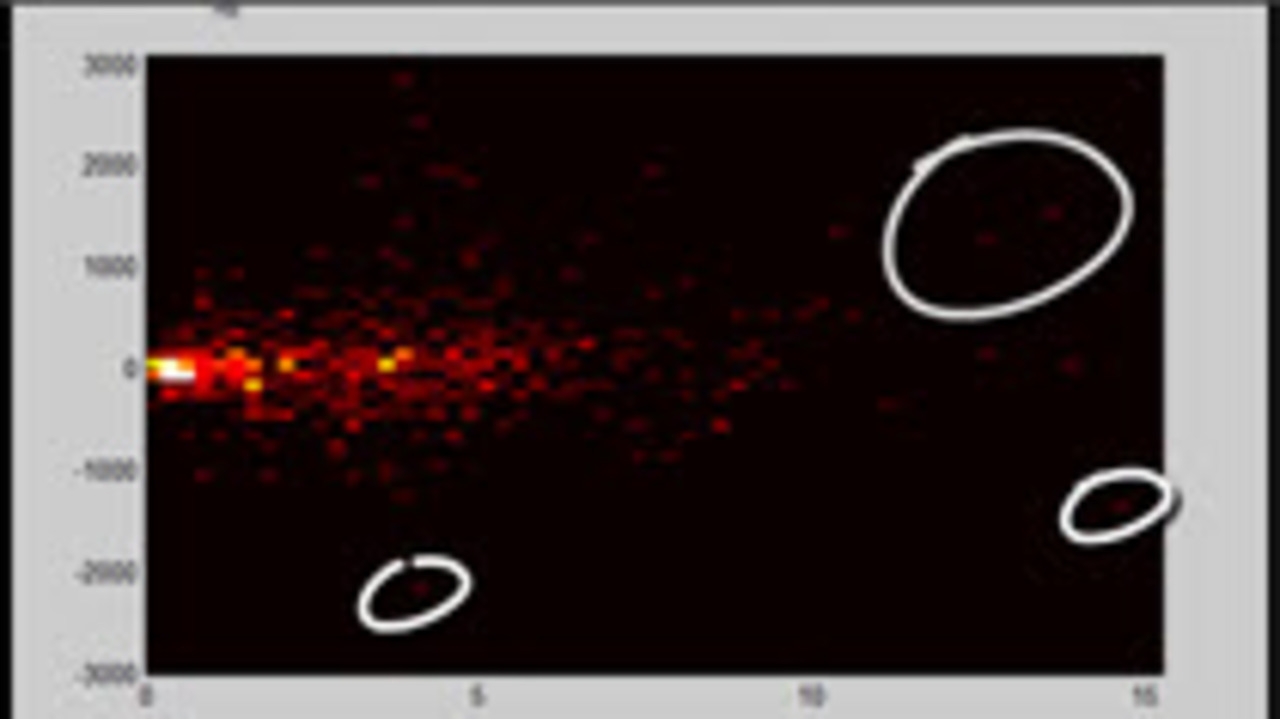
In this video we start with some data from a random process. Each piece of data represents a small time period and change in value. Think of it as something like a stock ticker, very noisy with a… 더 읽어보기 >>

In this video we start with some data from a random process. Each piece of data represents a small time period and change in value. Think of it as something like a stock ticker, very noisy with a… 더 읽어보기 >>
In the last video we interactively changed the colormap so that there was a clear break between negative, positive and NaN values. In this video, we change the range of data, so the colormap needs… 더 읽어보기 >>
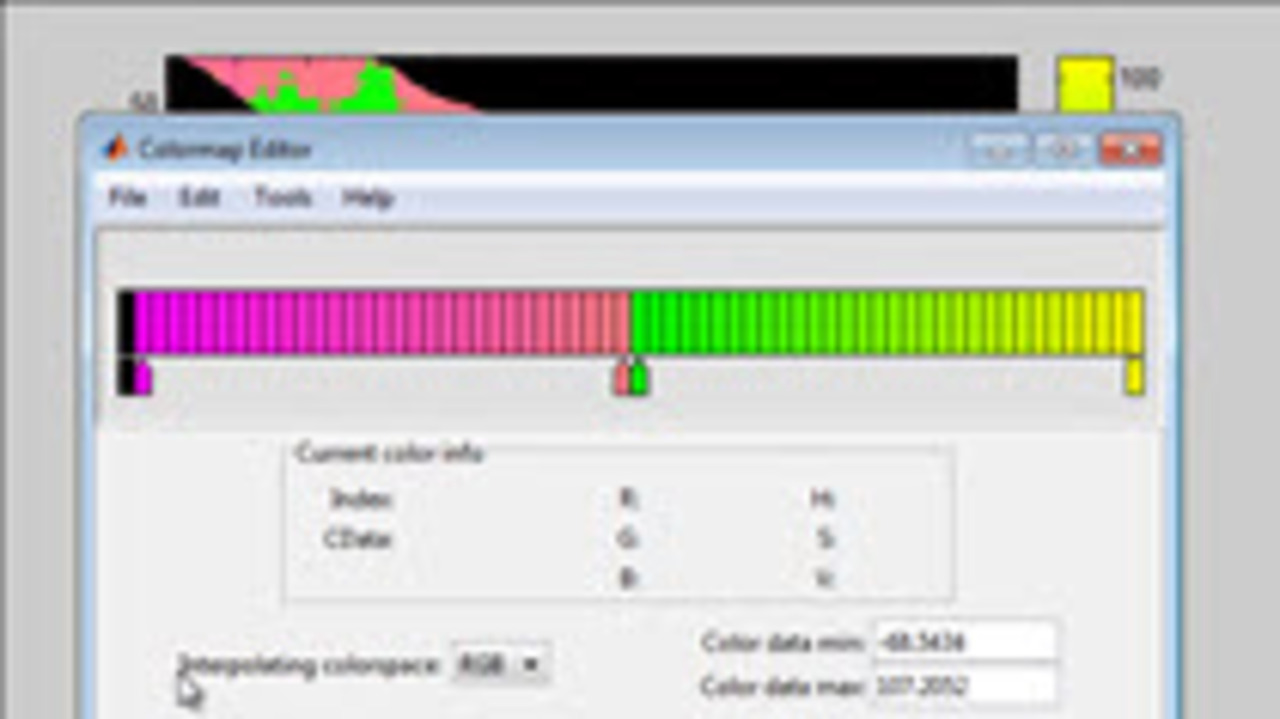
I was doing a visualization and needed to change to a custom colormap to get a better understanding of the data. This video shows how to interactively modify a colormap such that NaN values take on… 더 읽어보기 >>
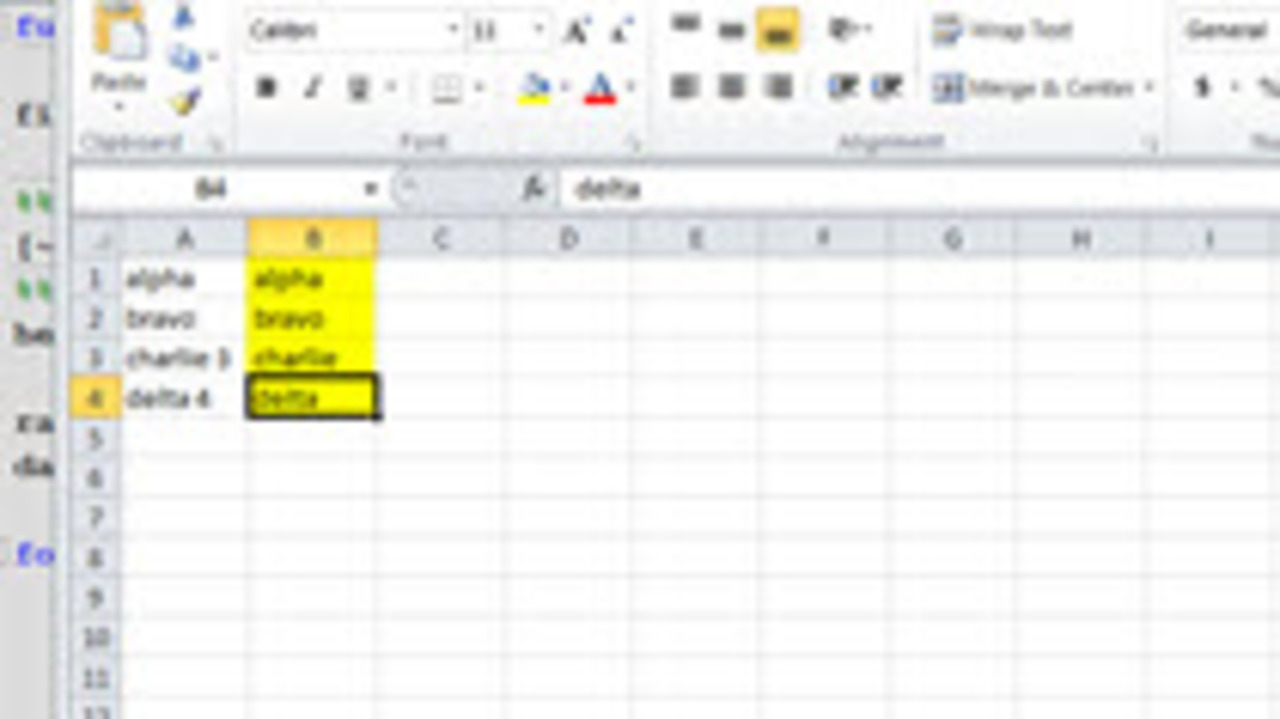
The changes that were suggested last week have been implemented. This shows how some small changes can really improve your code, making it more maintainable and expandable. It is good to be able to… 더 읽어보기 >>
