
Measuring and Monitoring Code Quality
This is the third instalment in my series on MATLAB Test. My previous posts introduced MATLAB Test and the Test Manager and the use of advanced coverage metrics.
Today I’m going to look at the Code Quality Dashboard which centralises a variety of metrics for your project and allows you to answer questions such as:
- Does my code have any issues identified by the MATLAB Code Analyzer?
- Does my project meet required coverage thresholds?
- Do I have failing tests and if so, how many?
- Are all my requirements linked to tests and have those tests been run?
To explore this more, I’m going to use the example project that comes with MATLAB Test which you can access by running:
openExample('matlabtest/CompleteTheVerificationOfAMATLABAlgorithmExample')
With your project open, open the Code Quality Dashboard by clicking the icon in the tools gallery:
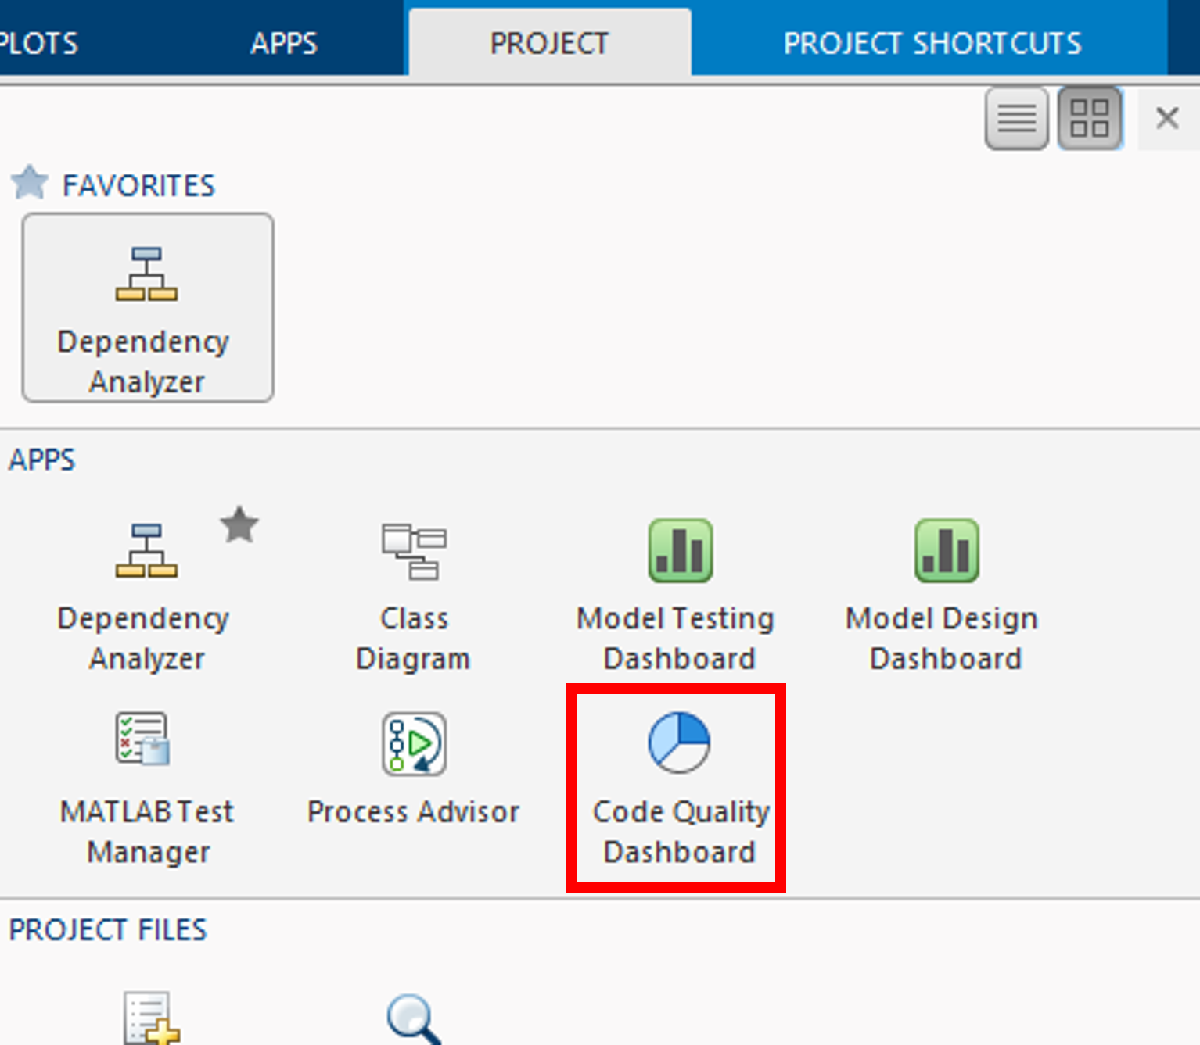
Open the Code Quality Dashboard from the tools gallery.
The first time the dashboard opens it will look like this:
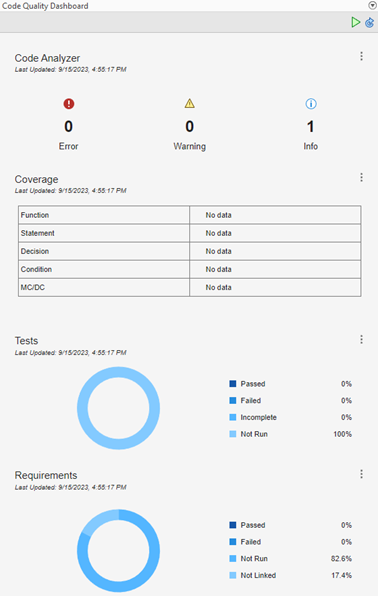
Initial state of Code Quality Dashboard.
There are 4 sections in the dashboard that bring together metrics from the MATLAB Code Analyzer, code coverage, tests, and requirements.
We’re currently missing test data as we haven’t run them yet – the tests are not run automatically as this could take a significant amount of time in a large project. You can run the tests from the Test Manager or you can use the button in the dashboard – click the 3 dots menu to the right of “Coverage” or “Tests” and select “Run Tests and Refresh Data”.
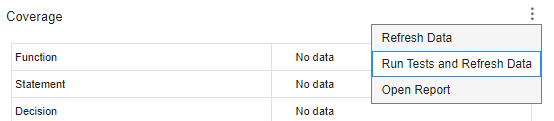
Run tests from the Code Quality Dashboard.
The dashboard now looks like this:

Code Quality Dashboard after tests have been run.
You can use this information to assess the current state of your project. For example:
- We have 1 suggestion identified by the Code Analyzer that we should review.
- Our statement coverage is 88%. This might mean that our code meets our company specified quality threshold.
- However, our MC/DC is low so there are definite gaps in our testing despite the high statement coverage.
- Some of our tests are failing so we’ll need to fix those.
- 17.4% of our requirements are not linked to tests in our project. Either they need to be linked to existing tests or we will need to write new tests.
To view more detail on any of the sections in the Code Quality Dashboard, click on a given section and a dedicated report will be launched. For example, clicking on the Code Analyzer section will launch this report:
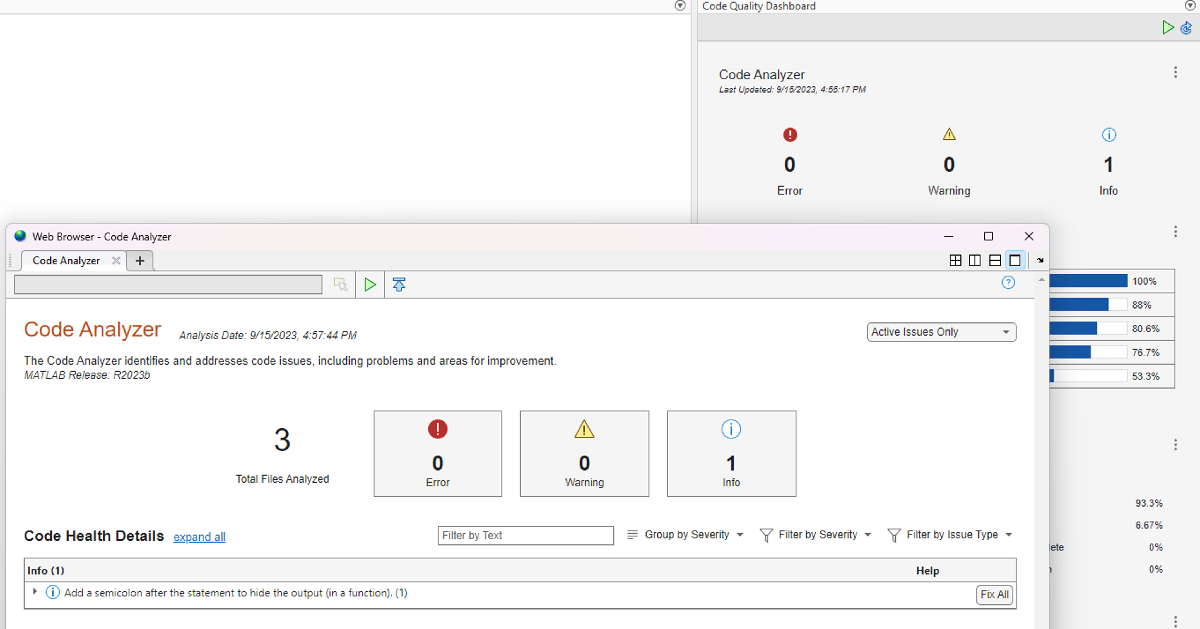
Code Analyzer report launched from the Code Quality Dashboard.
I’ll click the “Fix All” button to fix the issue. At this point a banner appears in the Code Quality Dashboard notifying us that files in the project have changed so the dashboard needs refreshing.
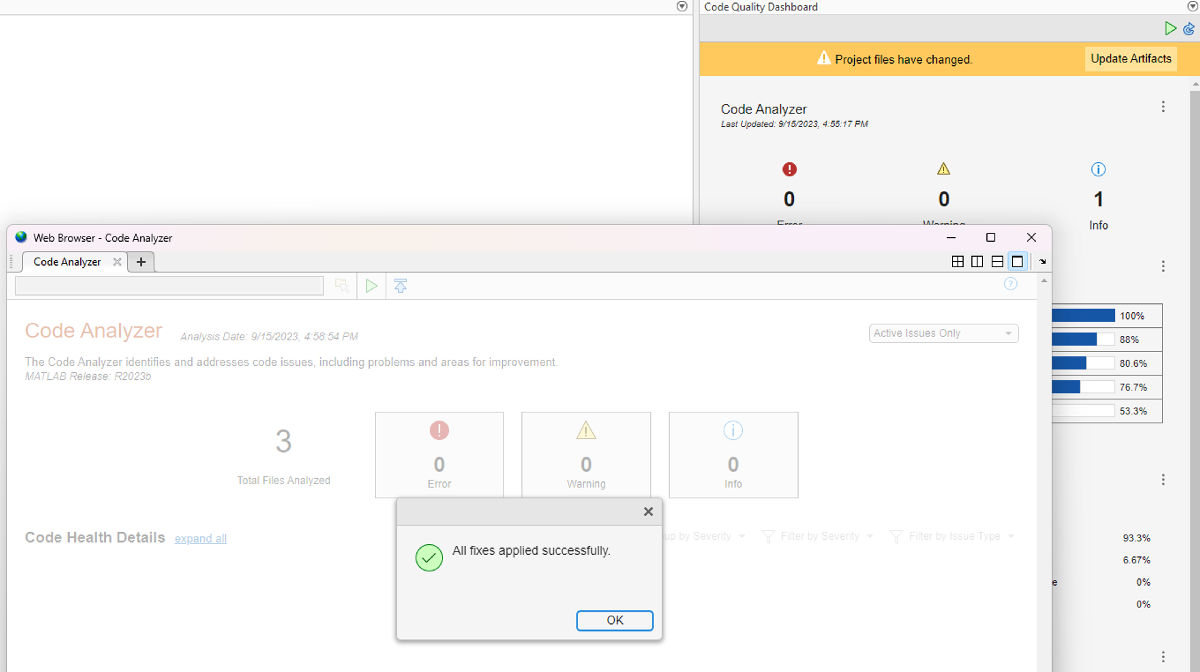
Code Analyzer issue fixed and Code Quality Dashboard indicating that a refresh is required.
Once we click the “Update Artifacts” button in the banner, we then need to click a subsequent “Refresh All” button to refresh the metrics, and our dashboard is up to date again.
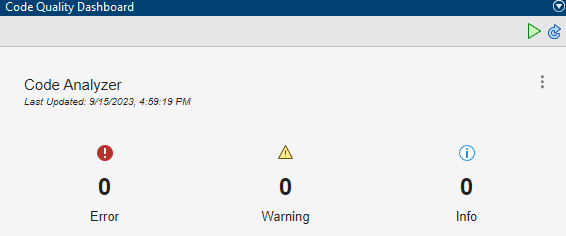
No more Code Analyzer issues following the update.
In summary, the Code Quality Dashboard brings together key metrics about your project in one place, allowing you to make informed decisions. It serves as the centre point of a “find and fix” workflow, allowing you to jump to more detailed views when you need them, and then coming back to the dashboard to view how your changes have affected the overall project status.
In the next post I’ll look at equivalence testing.


See Also
-

Introducing MATLAB Test!
Blogs
-

We’ve got you covered!
Blogs
-

Comma Separated Goodness
Blogs
-
-
-
评论
要发表评论,请点击 此处 登录到您的 MathWorks 帐户或创建一个新帐户。