
Guest Writers Ken Deeley Ken is an application engineer in Cambridge, UK, supporting MathWorks users with their technical computing projects. Ken joined the MathWorks customer... 更多内容 >>

Guest Writers Ken Deeley Ken is an application engineer in Cambridge, UK, supporting MathWorks users with their technical computing projects. Ken joined the MathWorks customer... 更多内容 >>
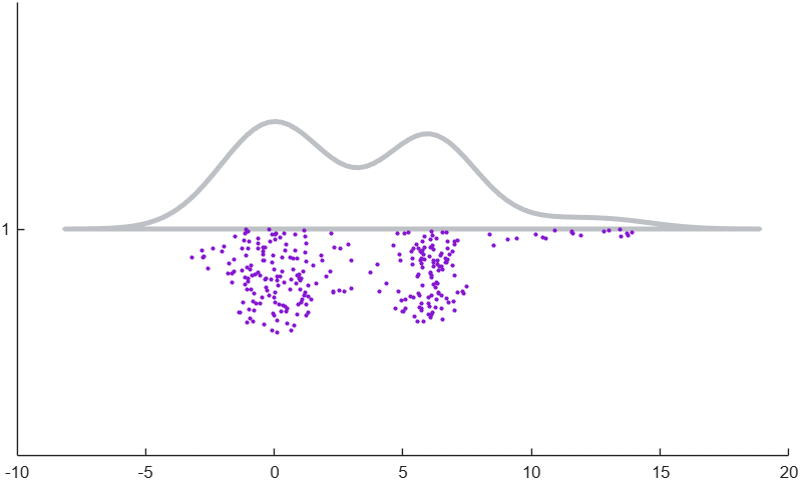
Guest Writer: Baldvin Einarsson Baldvin is a software engineer in the Statistics and Machine Learning Toolbox. His journey with MATLAB began in the early 2000s during his college years... 更多内容 >>

Guest Writer: Jessa Karlberg
Jessa is a software engineer on the Graphics Interactions and Accessibility team at MathWorks. After years of creating her own charts and data visualizations, she now... 更多内容 >>
The R2026a release is now available, and I’ve selected a few highlights to keep you up to date on the most important graphics and app building features. This release introduces a new way to publish... 更多内容 >>
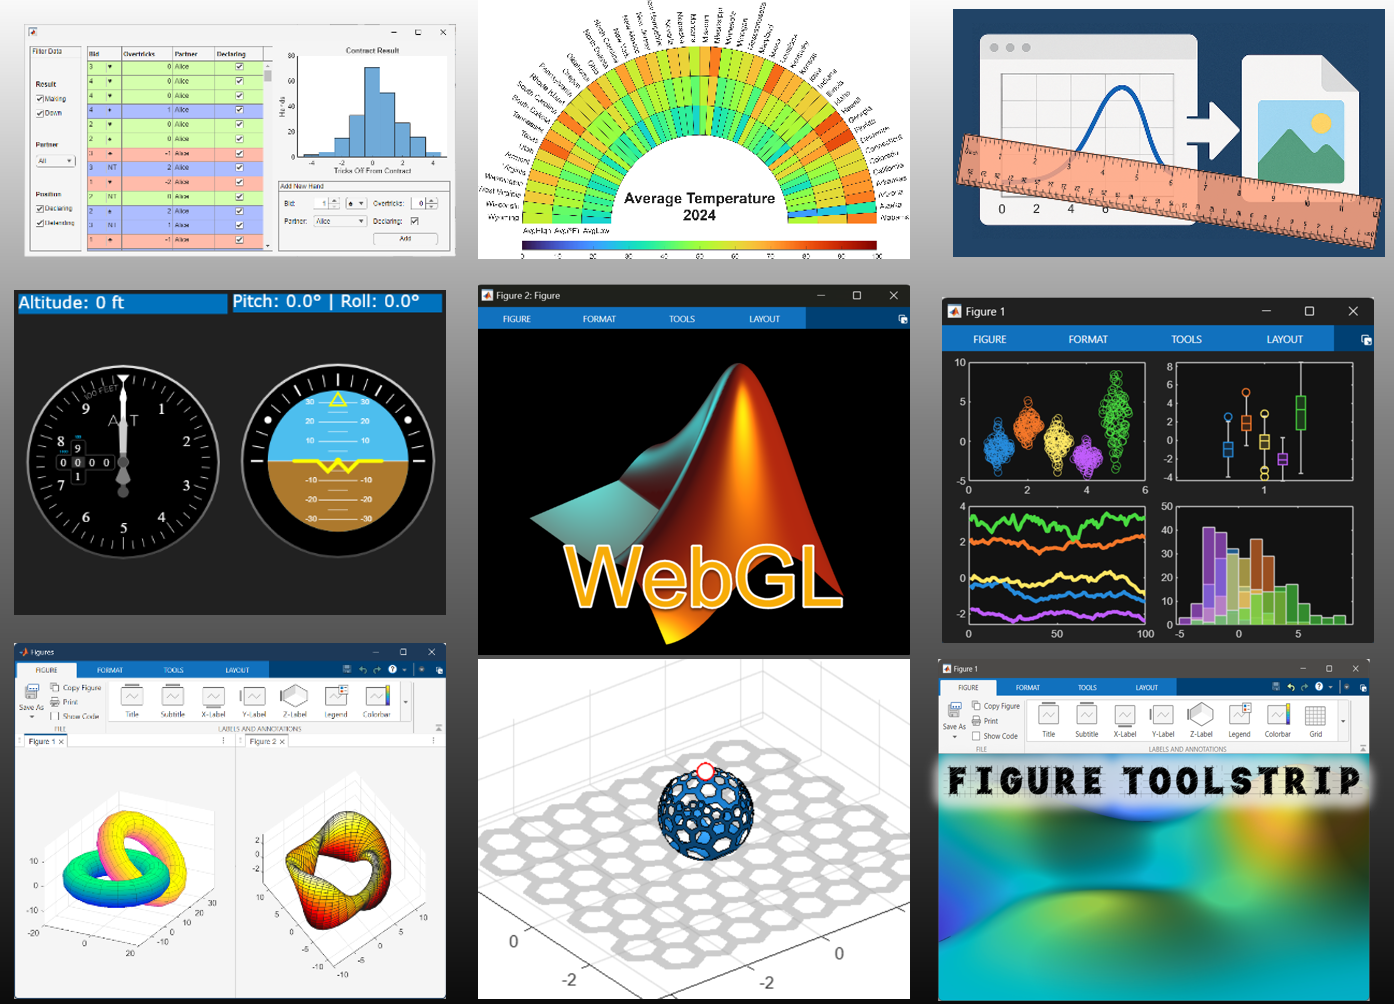
It was a big year for the MATLAB Graphics and App Building blog, from announcing a brand‑new WebGL‑based graphics system to introducing dark theme, modern figure tools, and updated app workflows.... 更多内容 >>

Guest Writer: Will Jackson
Will Jackson serves as the manager of the interactions and accessibility team for MATLAB. Will joined MathWorks in 2008 and contributed to the charting and interactions... 更多内容 >>

Guest Writer: Eric Ludlam Eric Ludlam is the development manager of MATLAB’s Charting team. Eric has a whopping 27 years of experience working in MATLAB Graphics, starting in MATLAB... 更多内容 >>
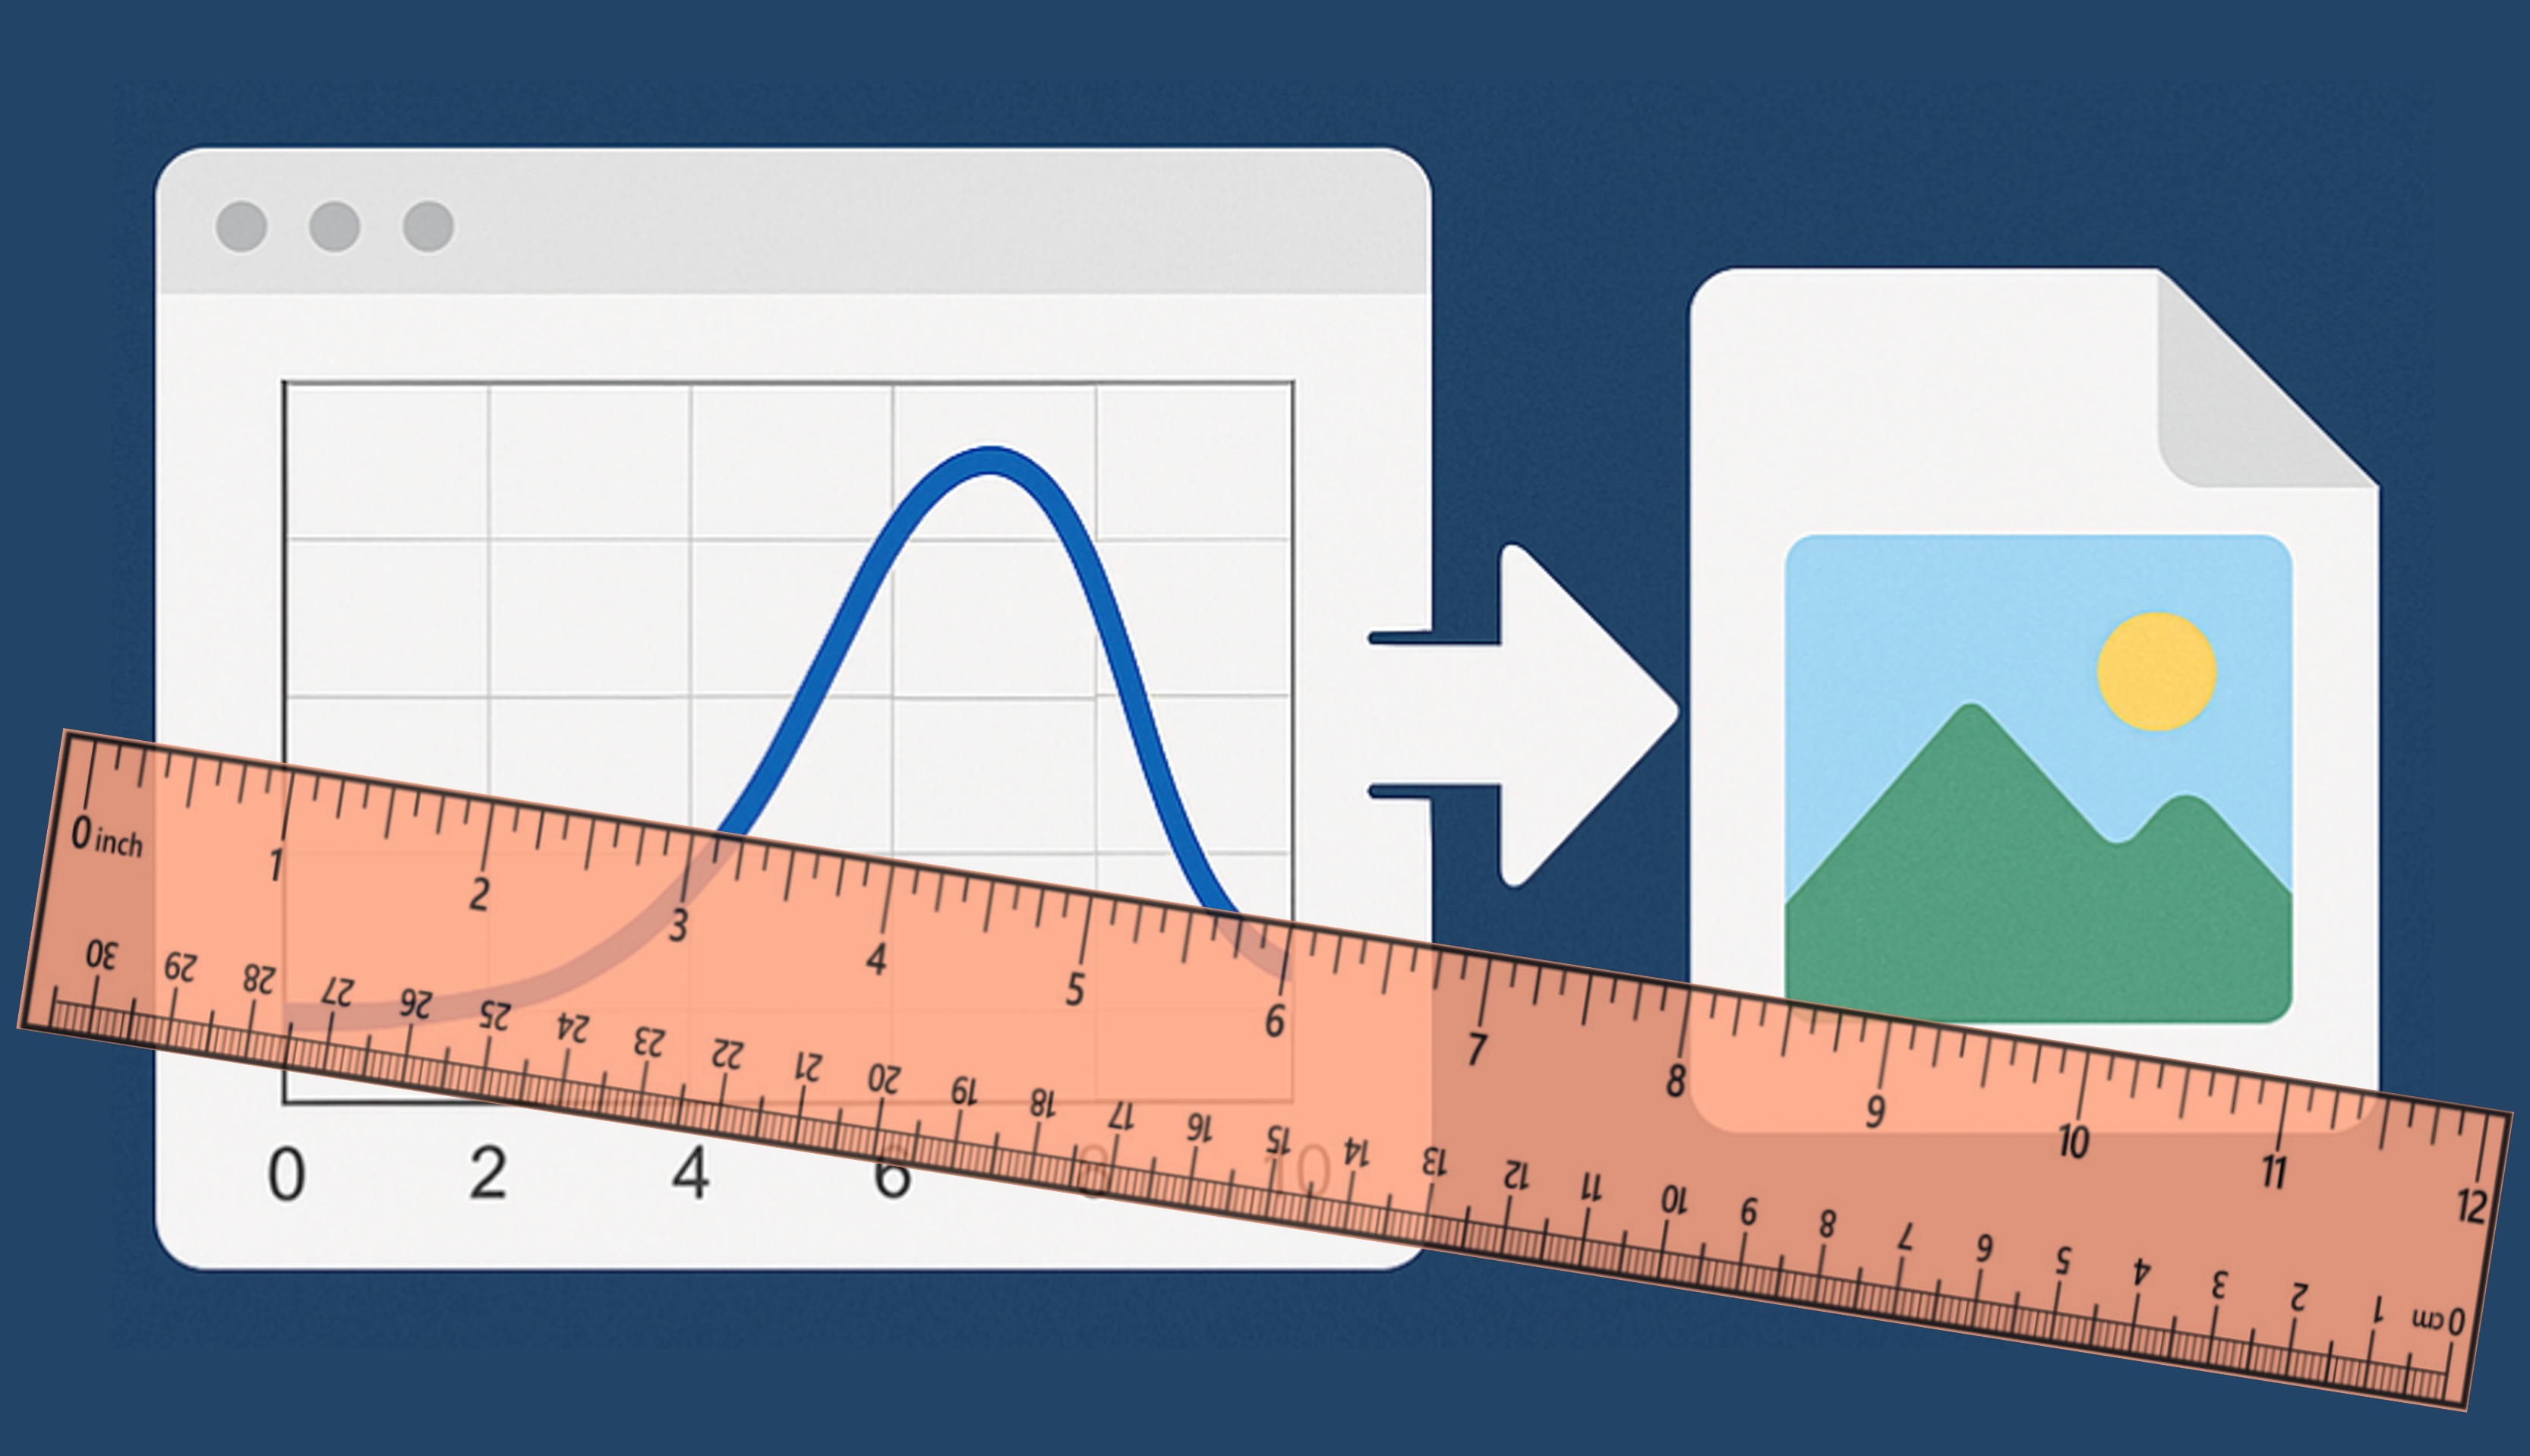
Guest Writer: Leia Rich Leia is a software engineer on the MATLAB Charting Team. She first joined MathWorks as part of the Engineering Development Group (EDG) in 2022, and later... 更多内容 >>
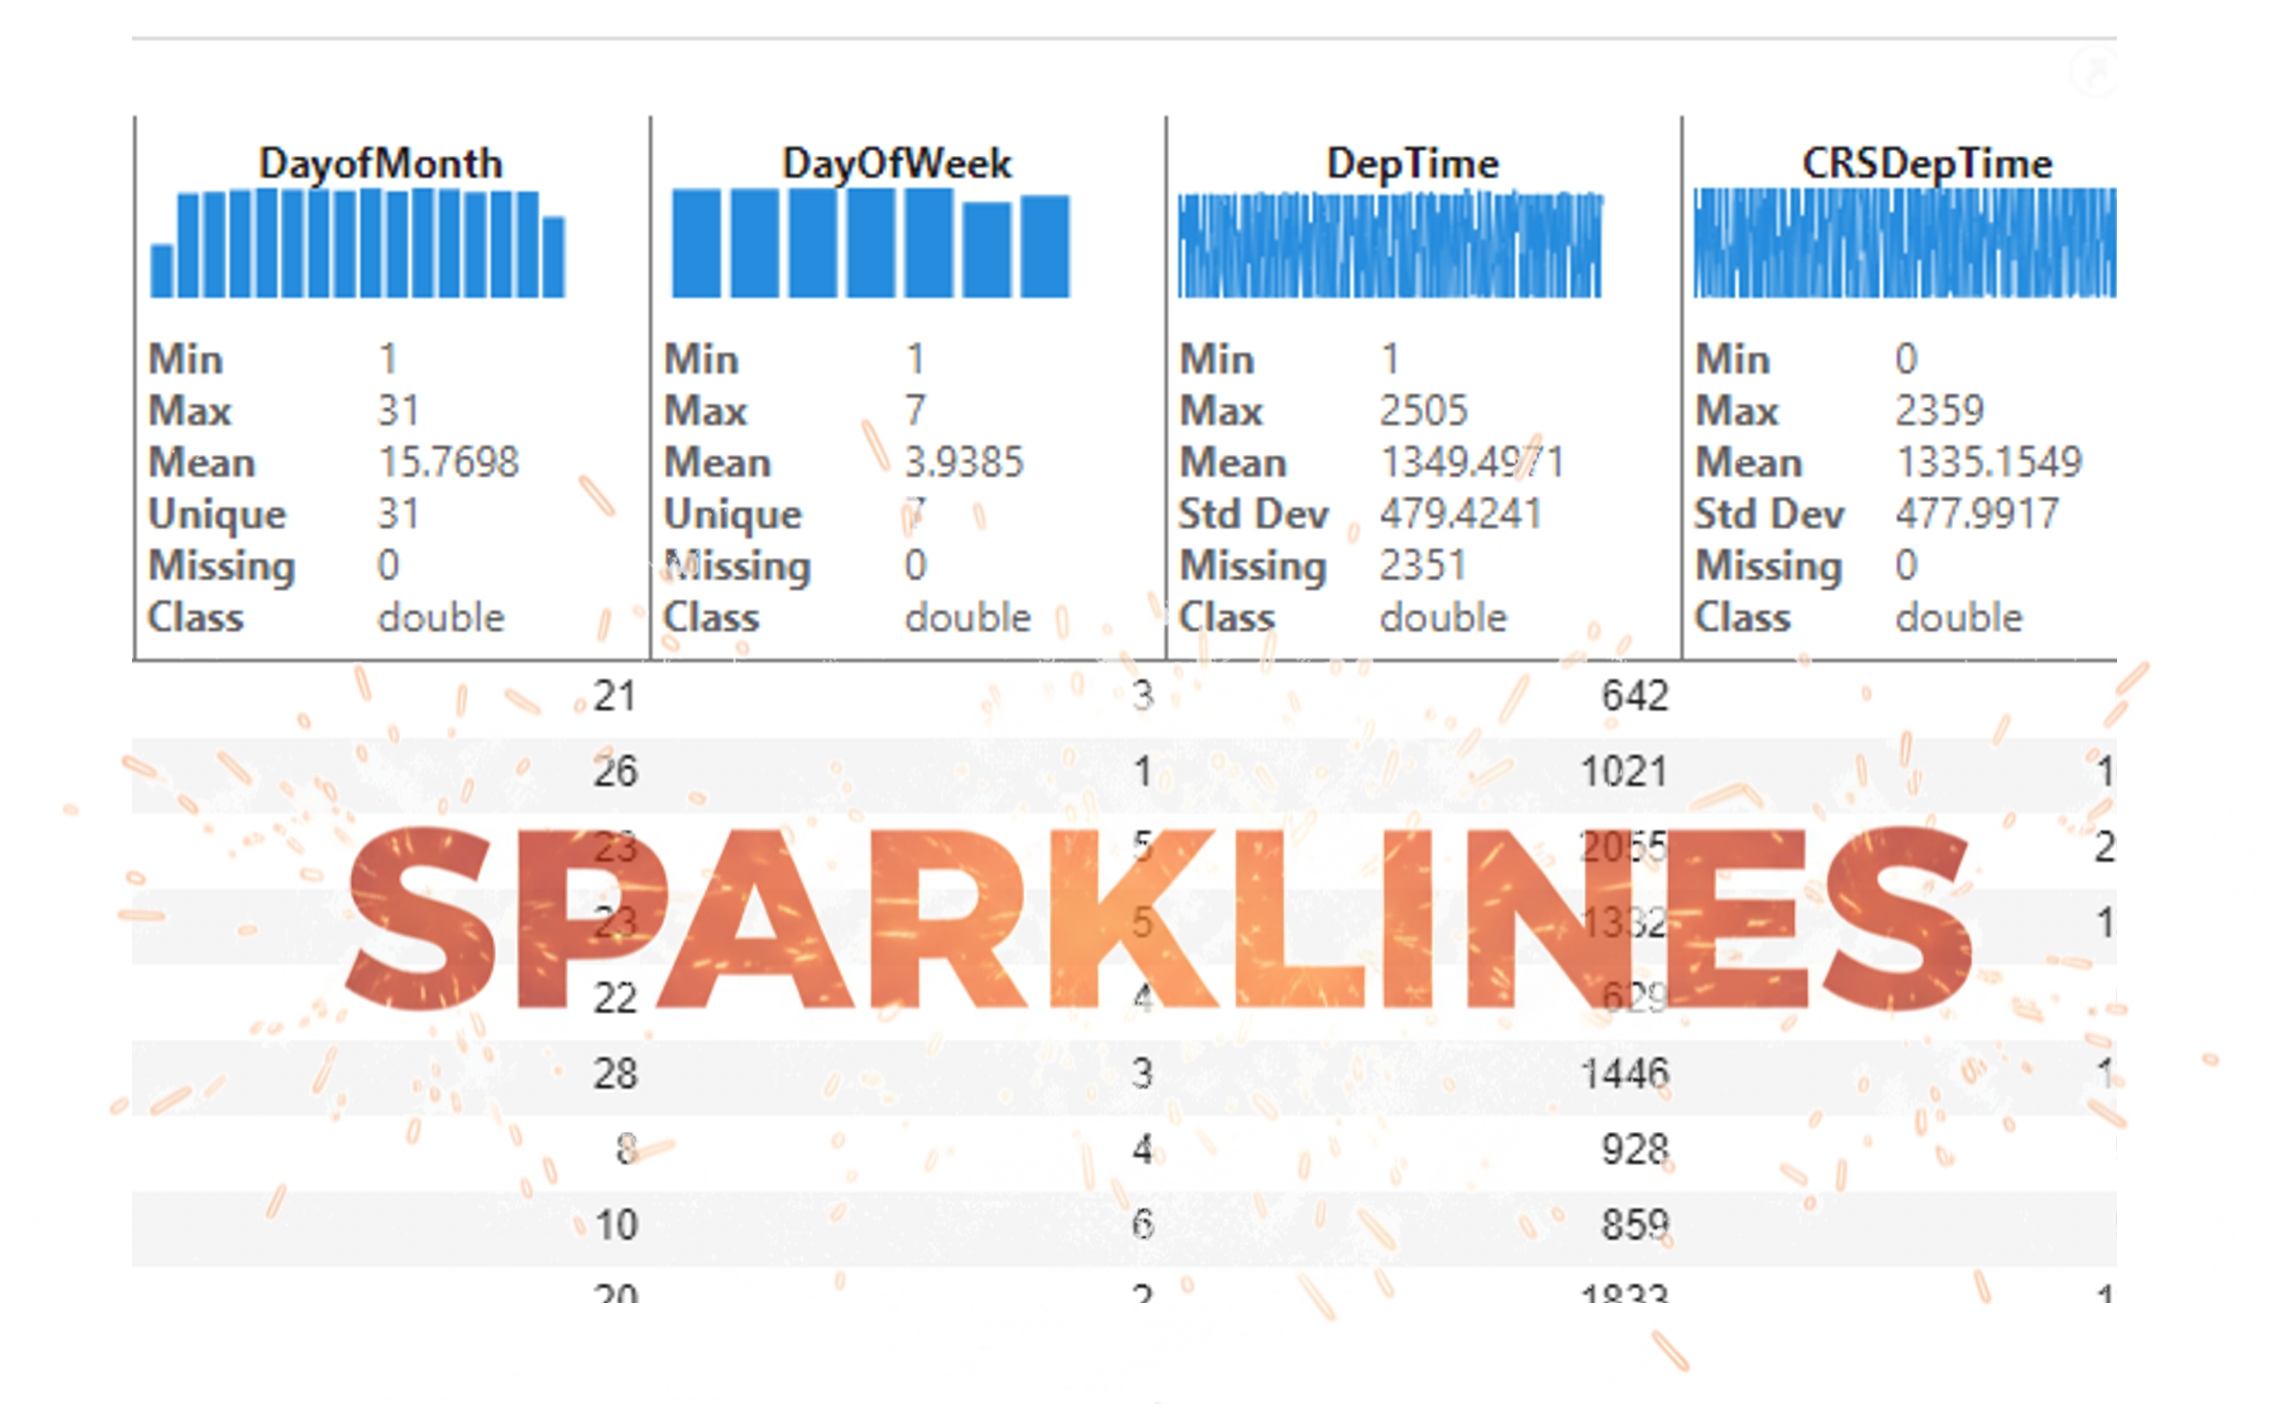
Did you know you can explore visualizations and basic statistics of tabular data directly within a live script without writing a single line of code? You can also change data types, sort, and filter... 更多内容 >>

Guest Writer: Maddie Moon
Maddie first worked with the Graphics and App Building team during her Engineering Development Group (EDG) internship in 2023. After graduating college, she... 更多内容 >>

这些文章由作者发布,不一定代表 MathWorks 的意见。