
Designing the New Figure Toolstrip Around User Experience
 |
Guest Writer: Travis Roderick Travis joined MathWorks in 2013, bringing experience from previous roles in software development across the healthcare, finance, and storage network industries. He earned a BA in Computer Science in 2001, followed by a master’s degree where he explored the intersection of technology and creativity—using probabilistic genetic algorithms to generate music for his thesis. Although he enjoys the challenges of coding, Travis is most passionate about solving user experience problems. He’s particularly interested in uncovering the gap between how software is designed to be used and how people actually use it—insights that often lead to meaningful improvements. At GAAB (Graphics and App Building), he finds the ideal environment to explore these dynamics and help shape better user experiences for all. |
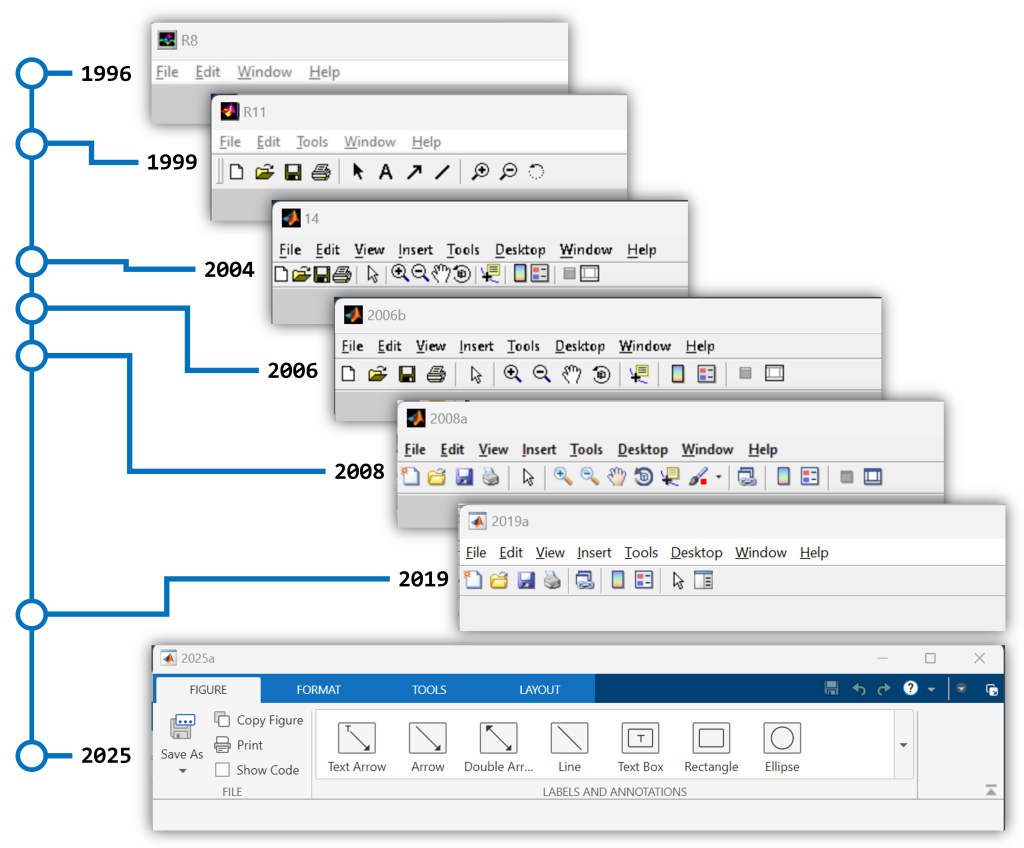
Whether you're plotting a basic line chart or creating an entirely new visualization from primitive graphics objects, your graphics appear in a figure window. Despite its importance, the figure interface has barely changed since the 1990s, still built around the same menus and toolbars shown in the image below.
Meanwhile, the rest of the MATLAB desktop has evolved. Open a Live Script, and you'll see a modern, streamlined toolstrip featuring labeled actions arranged into tabs that match common workflows and improve discoverability. This contrast made one thing clear: it was time for figures to catch up.
Timeline of figure toolbar changes
A User-Centered Redesign
Redesigning the figure UI was a daunting task. We knew we couldn’t simply port menu items into a toolstrip and call it a day. —we tried, but our internal review process challenged us to aim higher. Instead, we saw an opportunity to rethink the interactive figure experience from the ground up, focusing on user workflows. What followed was a collaborative journey involving UX (User Experience) researchers, developers, and—most importantly—our users.
Together with our UX team, we kicked off a series of user interviews. Our first conversations were with experienced MATLAB users. We observed their workflows: analyzing data, tweaking algorithms, and visualizing results. One pattern stood out immediately—their workflows were almost entirely programmatic. They wrote code, generated plots, adjusted the code, and repeated the process, all in scripts or from the command window.
So we asked our participants: why not use the interactive figure features?
Their answer was consistent. Paraphrased: "If I make changes interactively using the UI, I can’t reuse those changes. I have to repeat those steps manually every time I replot my data. It’s just wasted effort."
That insight sparked a major shift in our thinking. What if using the UI didn’t mean sacrificing reproducibility? What if we could provide users with code that reproduces the results of interactive gestures?
The Introduction of Interactive Code Generation
With the idea of interactive code generation in hand, we built a prototype and shared it internally. The response from colleagues across MathWorks was encouraging—but we needed to know what users thought.
So, we put together a live demo and brought it to the MathWorks Advisory Board (MAB), a group of professionals from various industries who provide early feedback on new features. Presenting an unfinished UI to seasoned users was a nerve-wracking experience.
But once they saw what we were working on, the reaction was overwhelmingly positive. The idea that you could interactively edit a plot and get the equivalent code was exactly the kind of workflow boost users were looking for. That early validation gave us the confidence to move forward.
When iterating on the code generation design, we knew it had to be easily discoverable, but it also had to stay out of the way when it's not needed. This is why the “Show Code” button on the FIGURE toolstrip tab is unchecked by default--the generated code only appears when the checkbox is selected.
Code generation demonstration
In the Code Generation panel that appears, click the “Copy” button to grab the code needed to reproduce your figure.
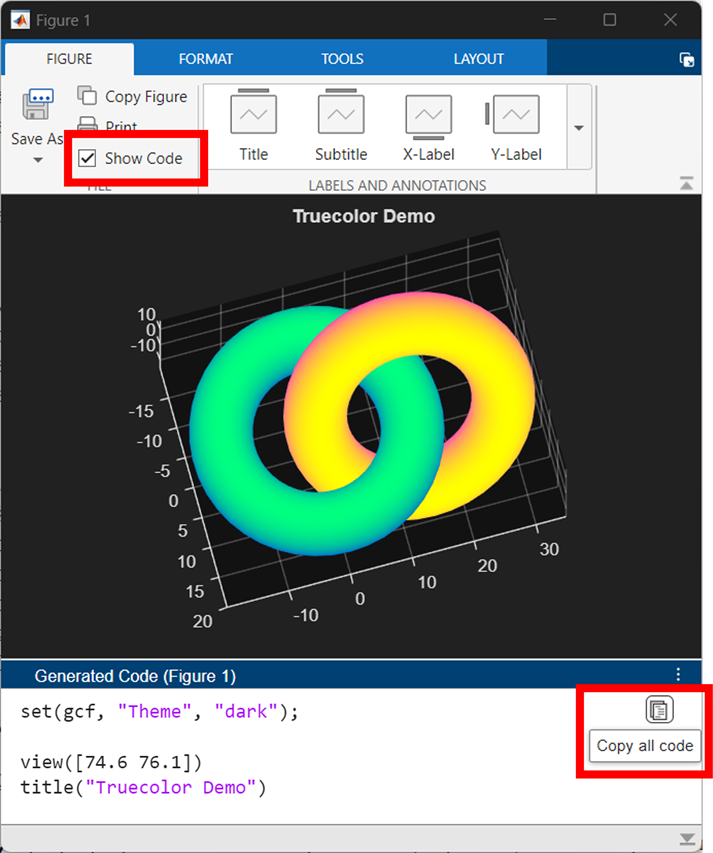
How to copy auto-generated code
Iterating with User Feedback
We initially released the updated figure design in MATLAB Online and in our beta desktop so that we could receive customer feedback to steer our iterations. After this first round of feedback, we worked closely with our UX partners to keep the momentum going. We ran regular usability sessions with MATLAB users—demoing changes, collecting feedback, and refining the design. Each cycle was hands-on: we would tweak the design, assemble a new demo, bring in users for test sessions, process their feedback, share it with stakeholders, and then repeat the process. This continuous feedback loop was essential in shaping an interface that felt intuitive, helpful, and supportive of the intended workflows.
Integrating the Toolstrip into the New Figure Ecosystem
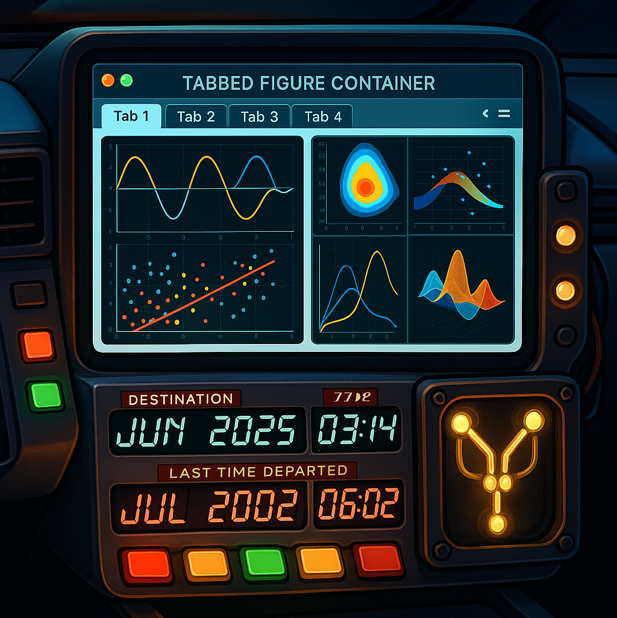
The figure ecosystem is the term we use to describe the way figures are presented and the supporting UI around them. With figures at the center in the image below, the new ecosystem includes the toolstrip (1), the new tabbed layout (2), side panels for UIs like the Property Inspector (3) and the interactively generated code (4). So, the new figure toolstrip is a part of a broader redesign of the figure ecosystem. While I focused on designing the figure toolstrip and reproducible interactive workflows, my colleague Brian Knolhoff tackled other critical features of the figure ecosystem—specifically, introducing a new tabbed layout. You can read more about his work in his article Introducing the Tabbed Figure Container.
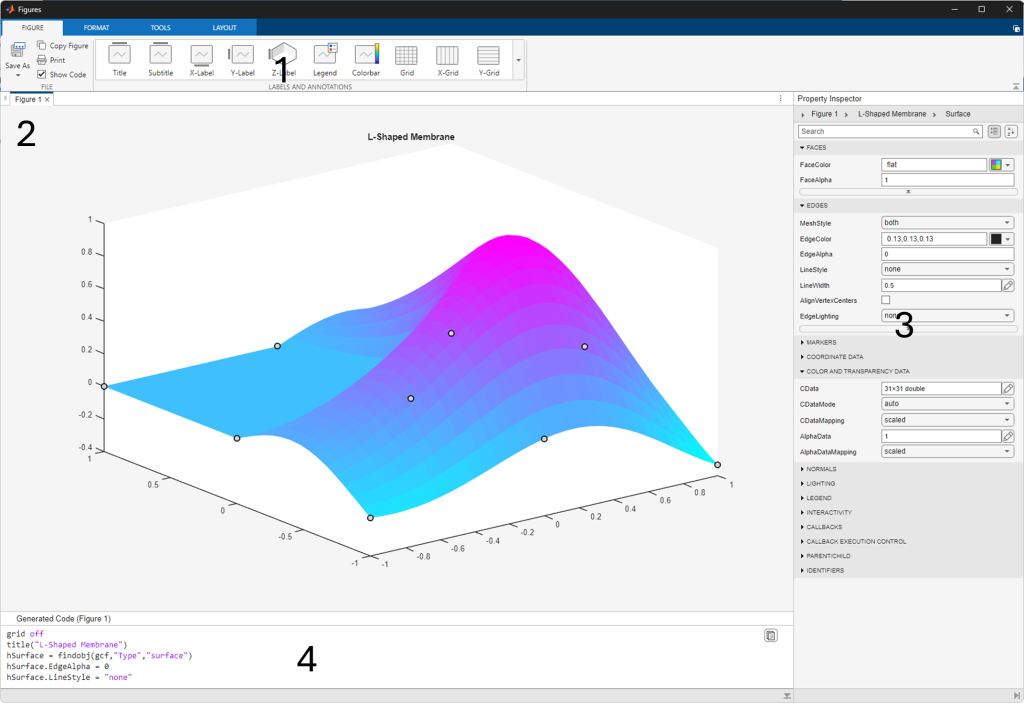
Components of the figure ecosystem
Contextual Placement of the Figure Toolstrip
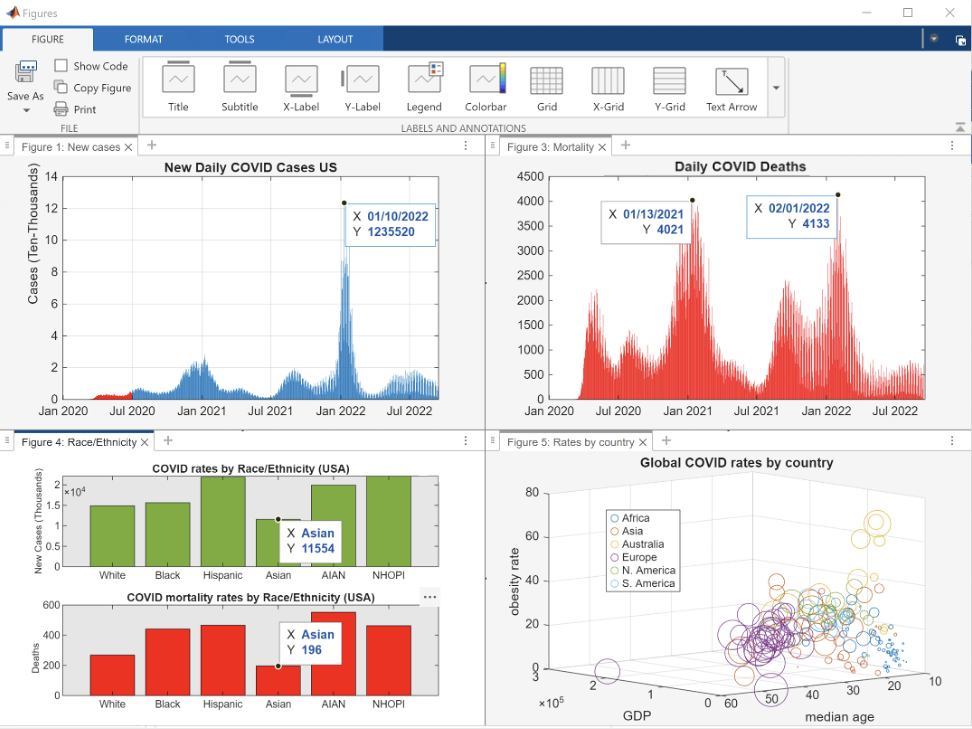
The figure toolstrip adapts to its environment so it stays accessible without getting in the way. By default, when a figure is first created, it appears in an undocked figure container with the toolstrip displayed at the top.
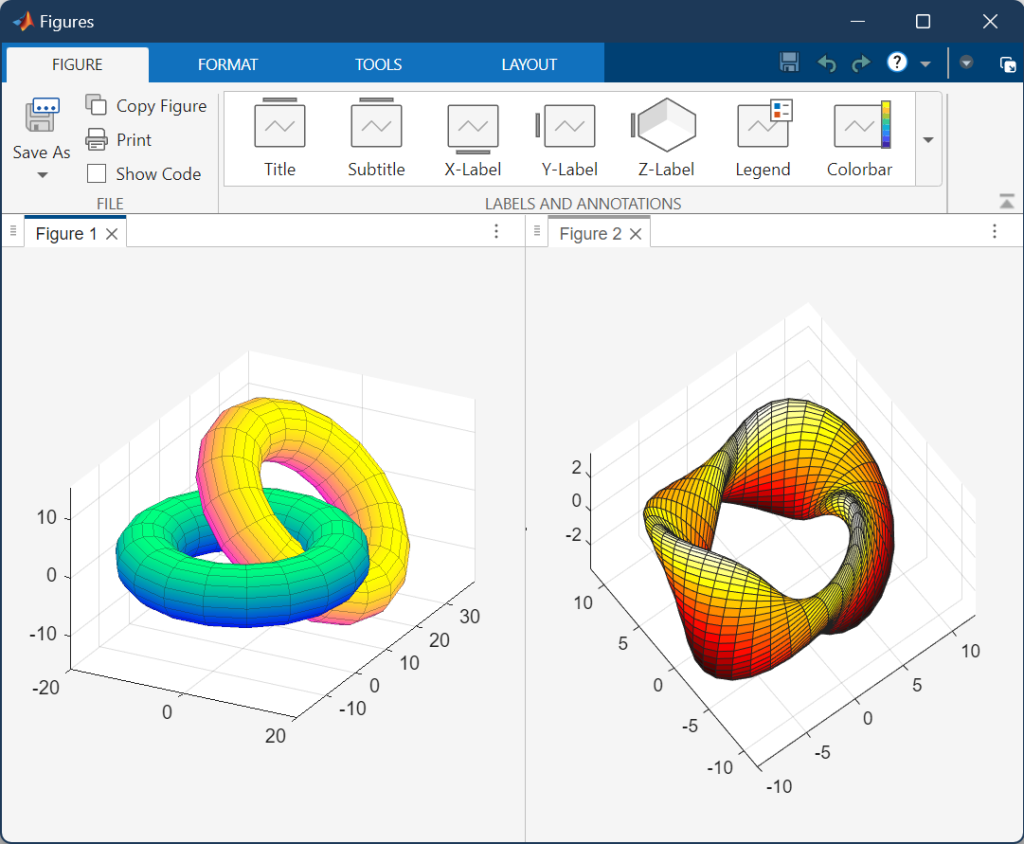
Figure toolstrip when the figure container is undocked
When the figure container is docked into the MATLAB desktop, the toolstrip becomes one of the available tabs in the MATLAB Desktop when the figure is selected.
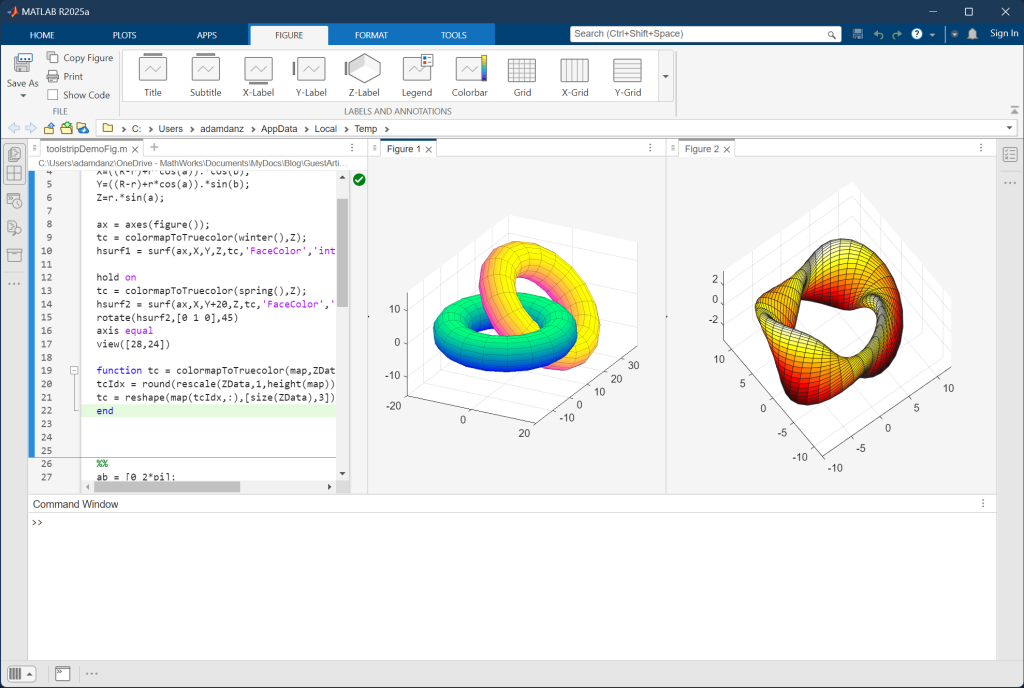
Figure toolstrip when the figure container is docked to the desktop
When a figure is undocked from the figure container, the toolstrip moves to the top of the figure window and is collapsed by default to preserve figure space.
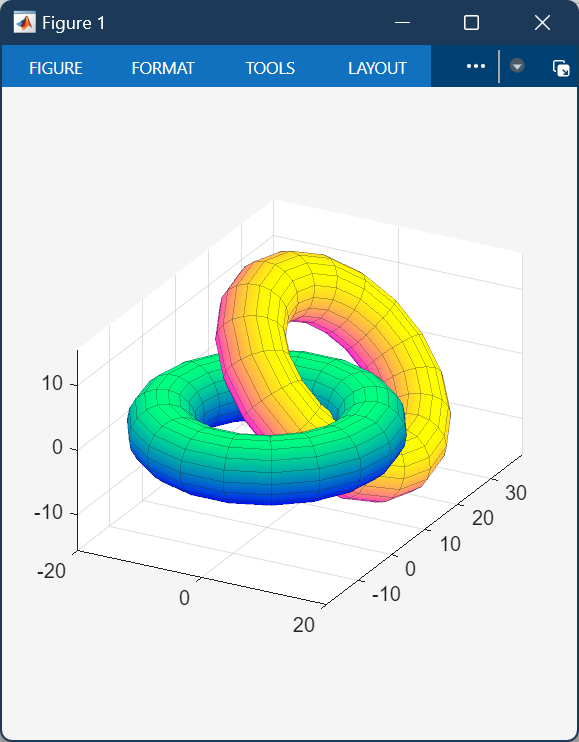
Figure toolstrip when the figure window is undocked from the figure container
The toolstrip responds dynamically to changes to figure content or selection. The first Figure tab allows you to easily insert items to the figure or plot like legends and labels. The Format tab allows you to activate editing mode to modify the properties of your graphics objects in the figure. The Tools tab provides an entry point for helper apps, like Basic Fitting. You’ll also find the Camera Tools there for 3D graphics. Finally, the Layout tab contains controls to quickly change between a grid view of your tabbed figures and the traditional single tab view.
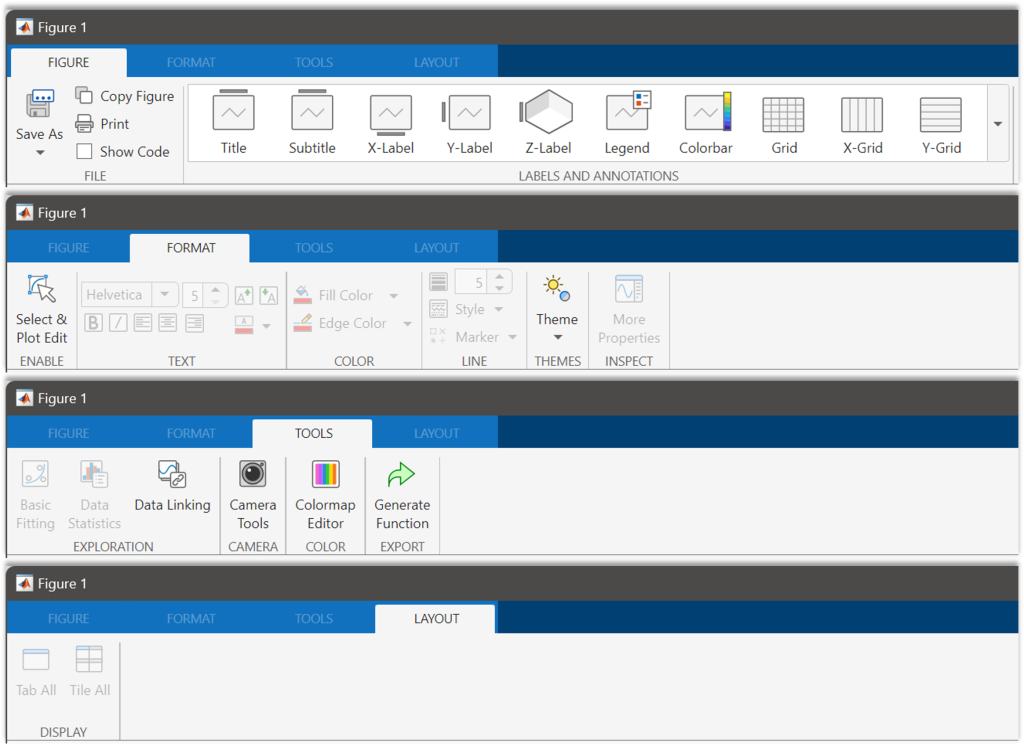
Figure toolstrip tabs
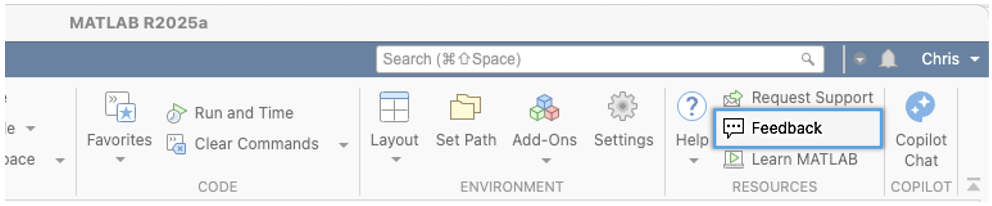
Try It and Share Your Feedback
We encourage you to explore the new figure toolstrip and interactive features. Try out controls that are unfamiliar to you, experiment with customizing your visualizations interactively, and take advantage of the code generator to reduce trial-and-error associated with programmatic approaches. As you discover new ways to work with figures, let us know what’s working well and where we can improve by replying directly to this article or by using the feedback button in the R2025a MATLAB desktop.
Help Shape the Future of MATLAB🔬
- カテゴリ:
- Demos,
- Graphics,
- New Features


コメント
コメントを残すには、ここ をクリックして MathWorks アカウントにサインインするか新しい MathWorks アカウントを作成します。