Guest Writer: Gianluca Carnielli
Gianluca is an application engineer at MathWorks based in Italy. While he supports MATLAB users in the development of applications in all sorts of engineering... read more >>

Guest Writer: Gianluca Carnielli
Gianluca is an application engineer at MathWorks based in Italy. While he supports MATLAB users in the development of applications in all sorts of engineering... read more >>

Guest Writer: Robert Philbrick
Robert Philbrick is a principal engineer responsible for new interactive App Designer workflows. He joined MathWorks in 2012 and has made many contributions to... read more >>

Guest Writer: Kristen Amaddio
Kristen Amaddio is the Senior Team Lead for the MATLAB UI Components team. She first joined MathWorks as part of the Engineering Development Group (EDG) in 2016,... read more >>

Guest Writer: Afiq Azaibi
Today's R2024a feature highlight is written by Afiq Azaibi, a developer on the Charting Team and a returning contributor to the Graphics and App Building blog. See... read more >>
Guest Writer: Ken Deeley
Ken is an application engineer in Cambridge, UK, supporting MathWorks users with their technical computing projects. Ken joined the MathWorks customer training team... read more >>

Guest Writer: Eric Ludlam
Joining us again is Eric Ludlam, development manager of MATLAB’s charting team. Discover more about Eric on our contributors bio page.
MATLAB Graphics supports... read more >>

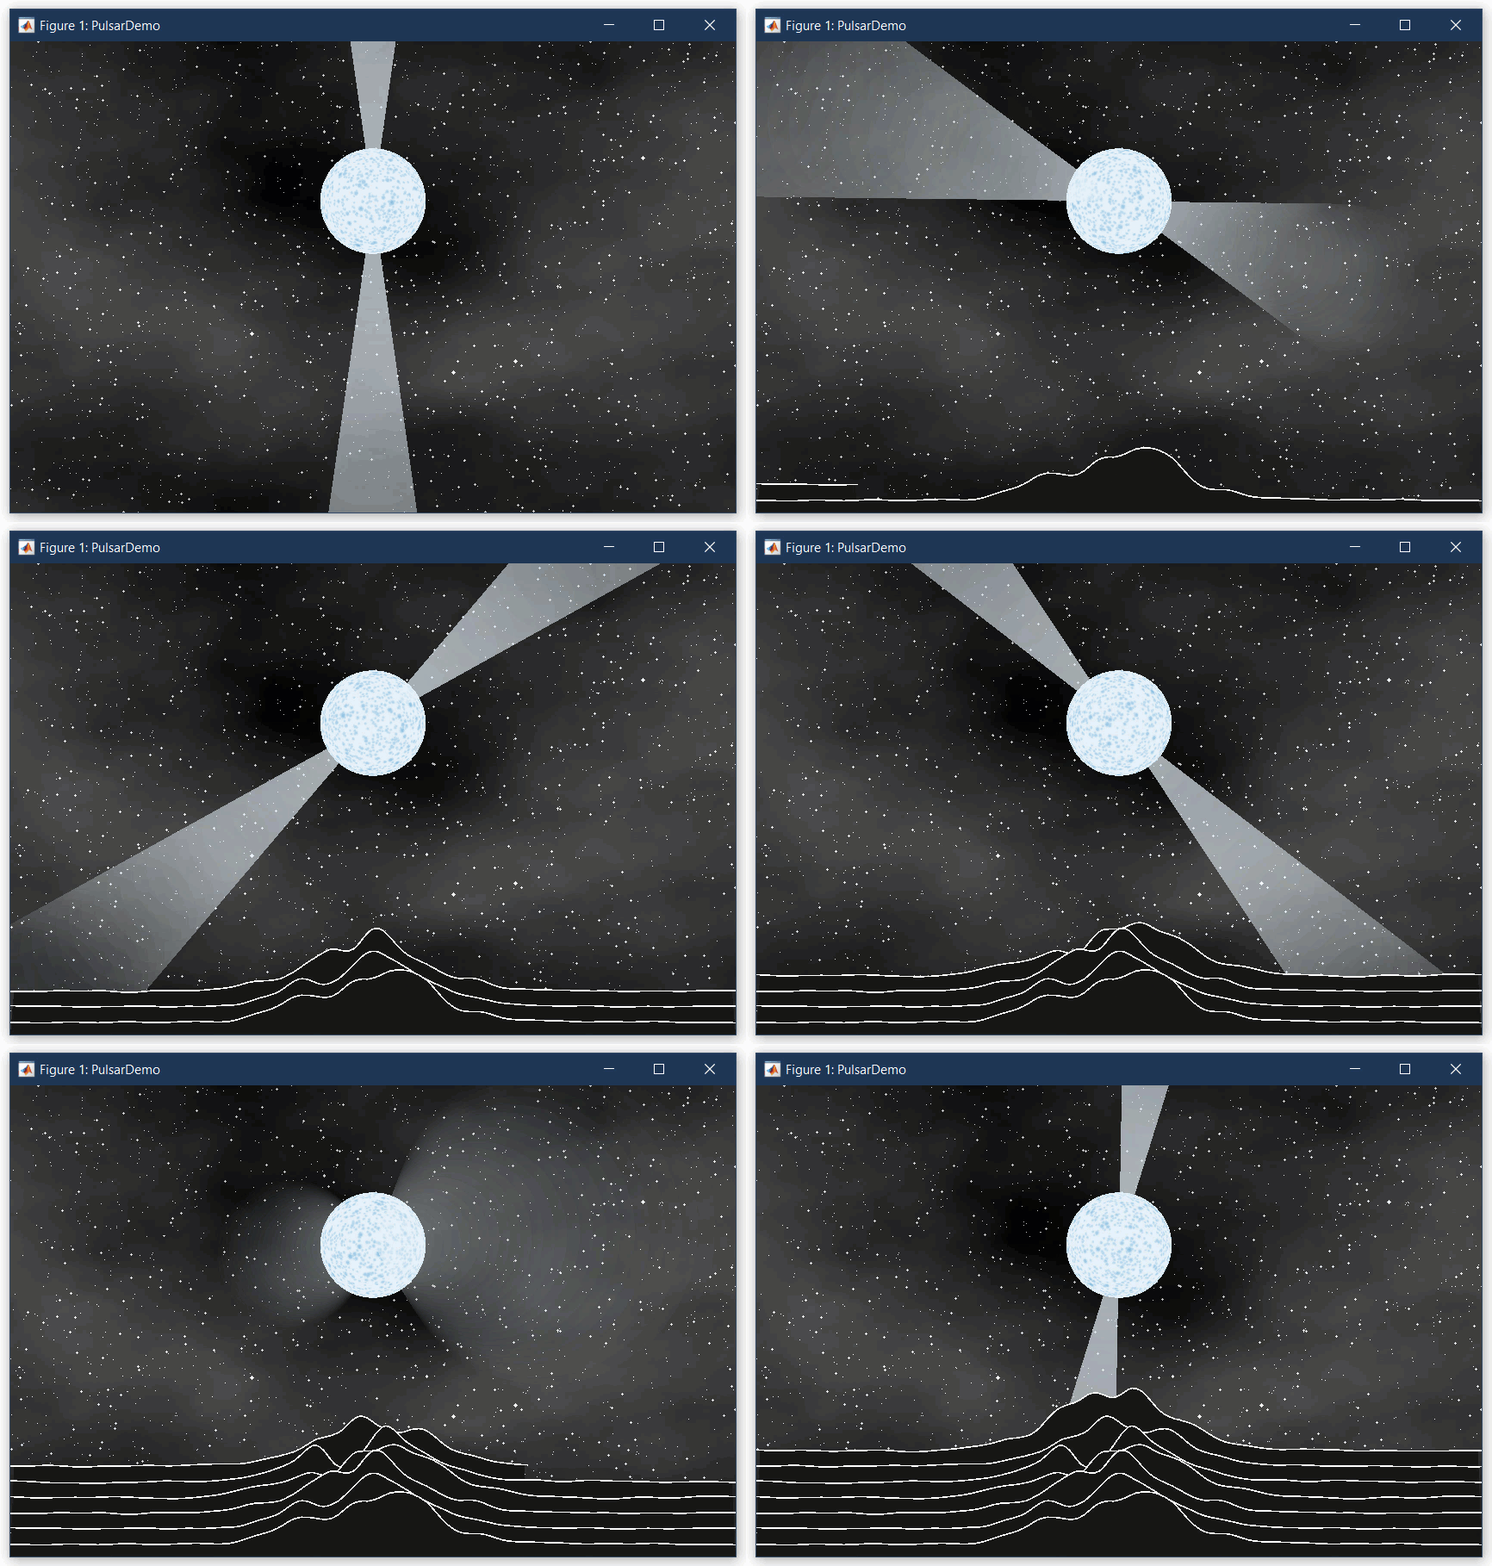
In 1979, an English rock band produced what Rolling Stone would describe as one of the best albums of all time with an album cover that would become iconic in data visualization. Joy Division's... read more >>

Guest Writer: Afiq Azaibi I’m happy to introduce Afiq Azaibi, a developer on the Charting Team at MathWorks and avid traveler. Afiq’s first contributions to the team have become... read more >>

Guest Writer: Abby Skofield
In today's article, Abby Skofield slices through the debate about pie charts and introduces two new delectable desserts recently added to the MATLAB menu. Abby is a... read more >>

Guest Writer: Eric Ludlam
Today's graphics adventure is written by Eric Ludlam, development manager of MATLAB's Charting team. Eric has a whopping 27 years of experience working in MATLAB... read more >>