
Guest Writer: Baldvin Einarsson Baldvin is a software engineer in the Statistics and Machine Learning Toolbox. His journey with MATLAB began in the early 2000s during his college years... 続きを読む >>

Guest Writer: Baldvin Einarsson Baldvin is a software engineer in the Statistics and Machine Learning Toolbox. His journey with MATLAB began in the early 2000s during his college years... 続きを読む >>


Guest Writer: Jessa Karlberg
Jessa is a software engineer on the Graphics Interactions and Accessibility team at MathWorks. After years of creating her own charts and data visualizations, she now... 続きを読む >>
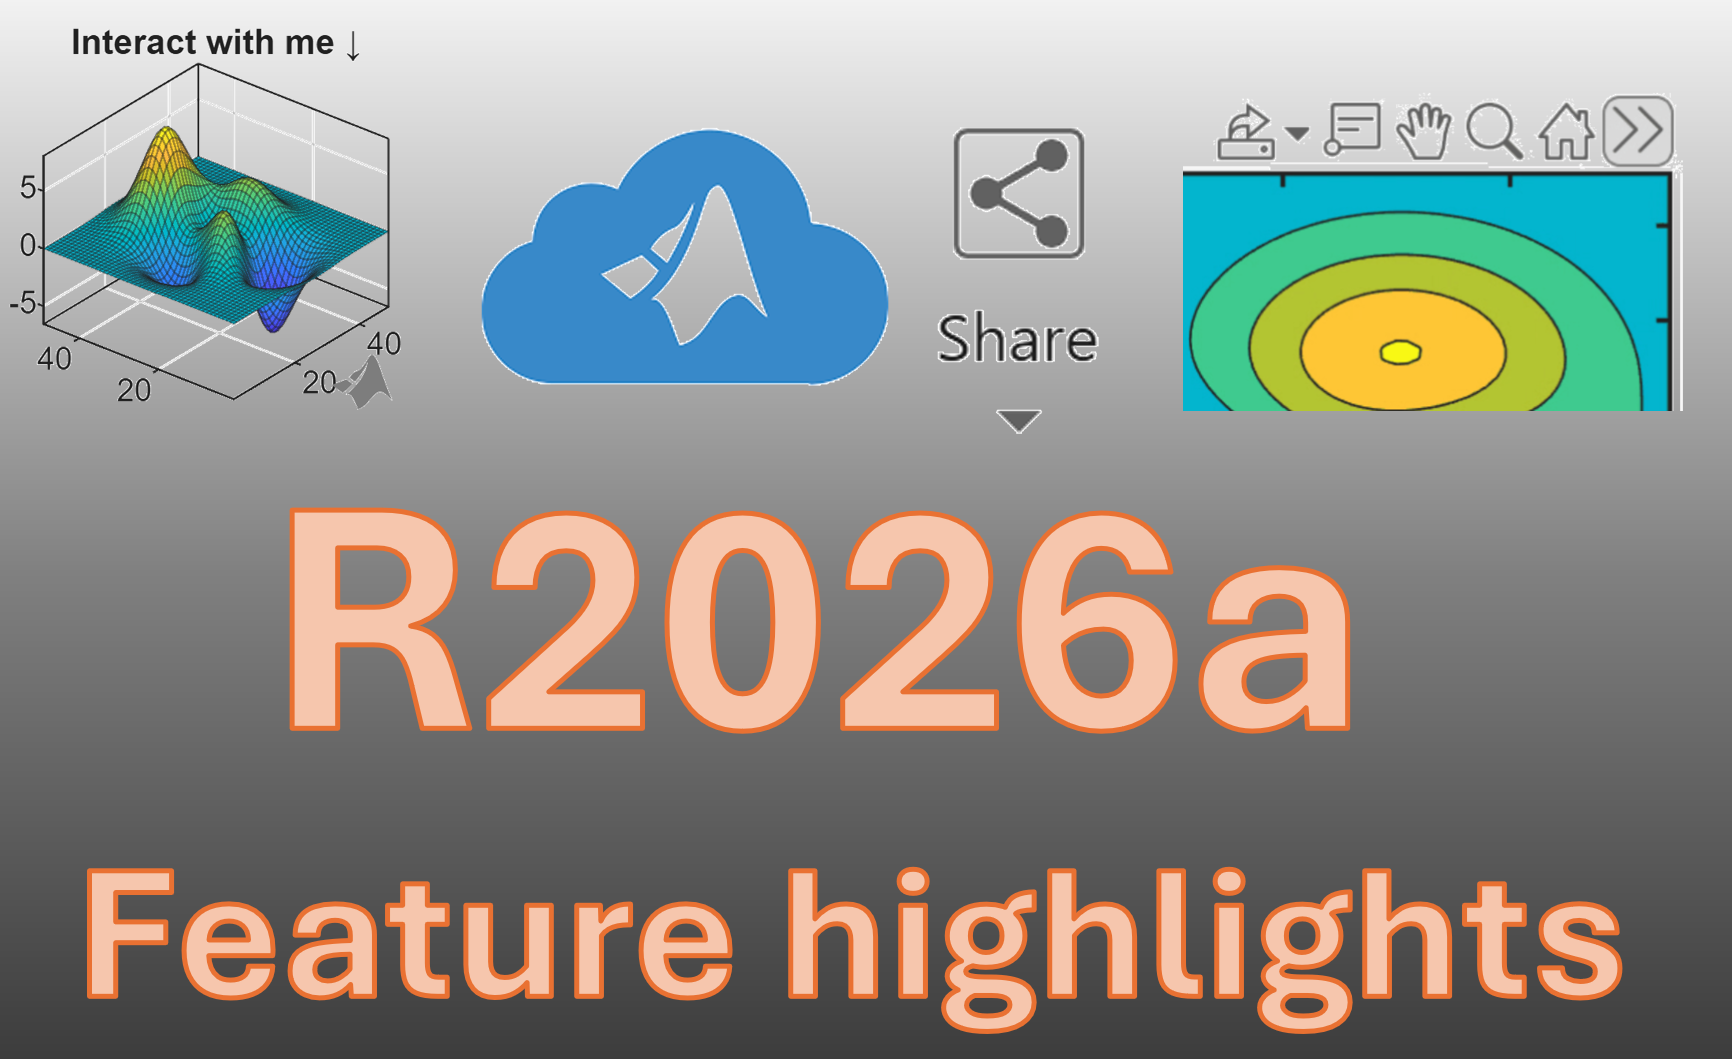
The R2026a release is now available, and I’ve selected a few highlights to keep you up to date on the most important graphics and app building features. This release introduces a new way to publish... 続きを読む >>

Guest Writer: Will Jackson
Will Jackson serves as the manager of the interactions and accessibility team for MATLAB. Will joined MathWorks in 2008 and contributed to the charting and interactions... 続きを読む >>
Guest Writer: Leia Rich Leia is a software engineer on the MATLAB Charting Team. She first joined MathWorks as part of the Engineering Development Group (EDG) in 2022, and later... 続きを読む >>

Guest Writer: Grant Marshall
Grant is a software engineer on the MATLAB Graphics & Charting Team. He first joined MathWorks in 2023 as a member of the Engineering Development Group (EDG) and... 続きを読む >>

Guest Writer: Jasmine PoppickJasmine works in documentation at MathWorks, both as a writer for the App Building area and as a Senior Team Lead for the Math area. Her first introduction to MATLAB... 続きを読む >>

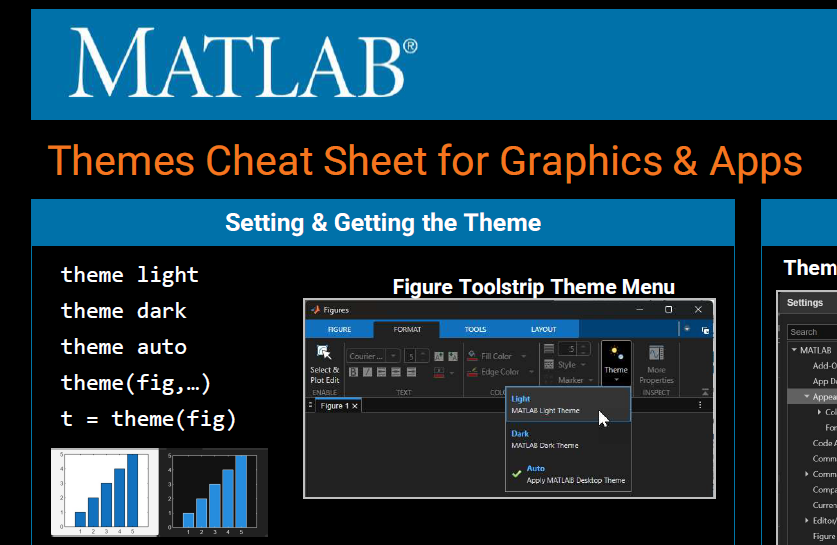
The long-awaited dark theme is now available in MATLAB R2025a. This article serves as a guide for designing charts and apps in a specific theme or that adapt automatically to either theme. By... 続きを読む >>
Guest Writer: Abby Skofield
We're excited to welcome Abby Skofield back to the blog! Abby has been at the forefront of bringing dark mode to MATLAB graphics and apps, and today she’s sharing... 続きを読む >>
Guest Writer: Travis Roderick
Travis joined MathWorks in 2013, bringing experience from previous roles in software development across the healthcare, finance, and storage network industries. He... 続きを読む >>