
Ellipse visualization and regionprops
A blog reader asked me recently how to visualize the ellipse-based measurements computed by regionprops. The reader wanted to superimpose the estimated ellipses on the image.
To refresh your memory: The function regionprops, which computes geometrical measurements of image regions, offers several measurements that are based on fitting an ellipse to the region. (If you must know, the ellipse fit is computing by matching second-order moments.) These measurements are:
- MajorAxisLength
- MinorAxisLength
- Orientation
I would plot an ellipse using a parametric equation. Conveniently, the Wikipedia article on ellipses has a parametric equation in a form that's just right:
$$X(t) = X_c + a \cos t \cos \phi - b \sin t \sin \phi$$
$$Y(t) = Y_c + a \cos t \sin \phi + b \sin t \cos \phi$$
where $(X_c,Y_c)$ is the ellipse center, $a$ and $b$ are the major and minor axis lengths, and $\phi$ is the angle between the x-axis and the major axis.
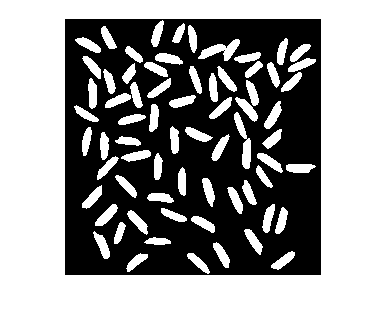
Let's try it with this image, which contains a bunch of ellipse-like objects:
url = 'https://blogs.mathworks.com/steve/files/rice-bw.png';
bw = imread(url);
imshow(bw)
Ask regionprops to compute all the ellipse-related measurements:
s = regionprops(bw,{...
    'Centroid',...
    'MajorAxisLength',...
    'MinorAxisLength',...
    'Orientation'})
s =

69x1 struct array with fields:

    Centroid
    MajorAxisLength
    MinorAxisLength
    Orientation
Here's what the measurements look like for the seventh object:
s(7)
ans =

           Centroid: [37.9286 226.9732]
    MajorAxisLength: 30.9655
    MinorAxisLength: 9.7466
        Orientation: -64.8058
Now write a loop that computes the ellipse curves one at a time, for each object, and superimposes the curve on the image.
figure
imshow(bw,'InitialMagnification','fit')

t = linspace(0,2*pi,50);

hold on
for k = 1:length(s)
    a = s(k).MajorAxisLength/2;
    b = s(k).MinorAxisLength/2;
    Xc = s(k).Centroid(1);
    Yc = s(k).Centroid(2);
    phi = deg2rad(-s(k).Orientation);
    x = Xc + a*cos(t)*cos(phi) - b*sin(t)*sin(phi);
    y = Yc + a*cos(t)*sin(phi) + b*sin(t)*cos(phi);
    plot(x,y,'r','Linewidth',5)
end
hold off
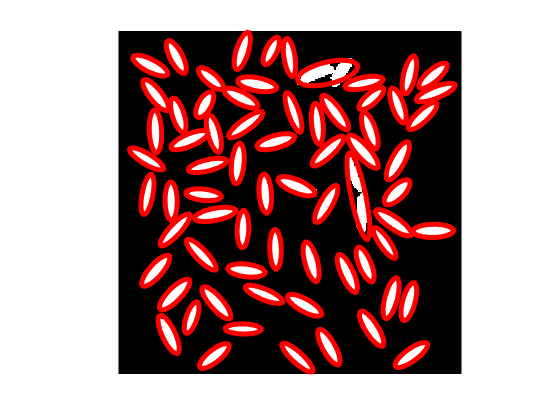
That's it!
Enjoy.


コメント
コメントを残すには、ここ をクリックして MathWorks アカウントにサインインするか新しい MathWorks アカウントを作成します。