Developing Inertial Navigation Systems with MATLAB – From Sensor Simulation to Sensor Fusion
I recently worked with Eric Hillsberg, Product Marketing Engineer, to assess MathWorks’ tools for inertial navigation, supported from Navigation Toolbox and Sensor Fusion and Tracking Toolbox. In this blog post, Eric Hillsberg will share MATLAB’s inertial navigation workflow which simplifies sensor data import, sensor simulation, sensor data analysis, and sensor fusion.

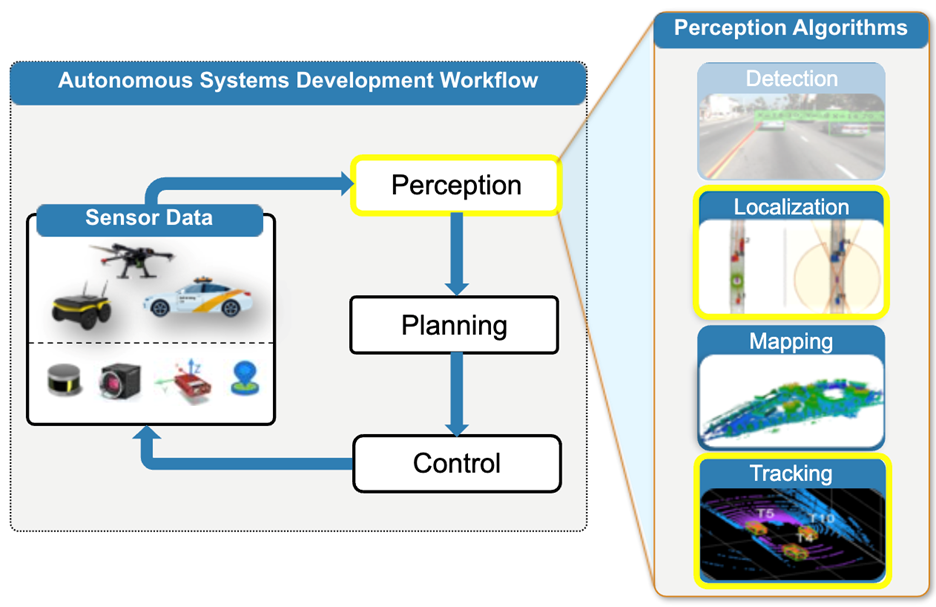
Fig.1 Localization is an essential part of the autonomous systems and smart devices development workflow, which includes estimating the position and orientation of a platform
Understanding Inertial Navigation Systems (INS)
Before we get into the content, I’d like to quickly touch on what I hope you can take away from this blog post. I will cover the basics of the Inertial Navigation Systems (INS) workflow in MATLAB, the benefits MATLAB provides, and which add-on product (Toolbox) is the best fit for the problem you are trying to solve. Now let’s talk about INS!
Sensors are used in various advanced systems such as autonomous vehicles, aircrafts, smartphones, wearable devices, VR/AR headsets, etc. For these applications, the ability to accurately perceive and locate the position and orientation of vehicles and objects in space is crucial. This process, known as localization, is foundational to planning and executing actions of these systems. Localization is enabled with sensor systems such as the Inertial Measurement Unit (IMU), often augmented by Global Positioning System (GPS), and filtering algorithms that together enable probabilistic determination of the system’s position and orientation.
Learn more about INS here - Inertial Navigation System
The Inertial Navigation Workflow in MATLAB

Fig. 2 Inertial Navigation Workflow with MATLAB – From ways to bring data into MATLAB to estimate a pose.
The workflow for implementing INS in MATLAB is structured into three main steps:
- Sensor Data Acquisition or Simulation: This initial step involves either bringing in real sensor data from hardware sensors or simulating sensor data using “ground truth” data. Simulation of sensor behavior and system testing can be significantly enhanced using the wide range of sensor models with tunable parameters available in MATLAB and Navigation Toolbox.
- Analysis and Calibration: Once sensor data is acquired, the next step is to analyze and calibrate the sensors. This process is crucial for ensuring the accuracy of the data collected from hardware sensors deployed in real-world systems.
- Localization via Sensor Fusion: The final step involves the use of sensor fusion algorithms to combine data from various sensors to accurately localize the system. This process is vital for the precise determination of a platform’s pose (position and orientation). This also involves tuning the fusion filters to obtain the pose when the filters are deployed.
For a deeper dive into the Inertial Navigation Workflow, consider watching this informative webinar.
Simulating Sensors
Simulation plays a critical role in the development and testing of Inertial Navigation Systems. MATLAB offers a comprehensive suite of tools for:
- Simulating a wide range of sensors including IMUs and GNSS, but also altimeters, wheel encoders, and more
- Allowing users to model real-world sensors based on spec sheets using JSON or parameterization
- Simulate sensor characteristics including misalignment, outages, and temperature errors to test the limits of your Inertial Navigation Systems

Fig. 3 Output plots from the example on Simulating IMU data in Navigation Toolbox showing the ideal and white noise gyroscope data
For more details, visit the doc page - Introduction to Simulating IMU Measurements
Analysis and Calibration of Sensor Data
After simulating or acquiring sensor data, MATLAB facilitates in-depth analysis of sensor performance, allowing for the calibration of various sensor errors and biases. This step:
- Improves the quality of sensor data by limiting or removing issues like hard and soft iron distortions
- Which in turn, enhances the overall performance of the localization process
By addressing sensor errors and environmental effects, MATLAB helps create a robust foundation for sensor fusion leading to more accurate system localization.
For more details, check out the examples in the links below
![The image depicts a series of four graphs related to 3D data analysis. Let me describe each graph:Logged Euler Angles: This graph shows logged Euler angles with three lines representing different axes (x, y, and z). The colors indicate the axes: red for x, yellow for y, and blue for z. Aligned Euler Angles: Similar to the first graph, this one displays aligned Euler angles using an [imfilter]. Again, the three axes are represented. Original Data and Best Fit Ellipsoid Using Auto Filter: In this graph, you’ll find a dense scatter plot of points forming an ellipsoid shape. Various colors indicate data noise. Corrected Data Fit to Ideal Sphere: The fourth graph depicts a similar scatter plot, but it has been adjusted to form a more spherical shape. These visualizations are significant for understanding 3D modeling, data correction, and applications in computer vision or robotics.](http://blogs.mathworks.com/autonomous-systems/files/2024/07/Picture4.png)
Fig. 4 Output plots from the examples in Navigation Toolbox on Aligning Logged Sensor Data and Calibrating Magnetometer
Sensor Fusion in MATLAB
Sensor Fusion is a powerful technique that combines data from multiple sensors to achieve more accurate localization. MATLAB simplifies this process with:
- Autotuning and parameterization of filters to allow beginner users to get started quickly and experts to have as much control as they require
- Supporting a wide range of sensor types to allow for fusion of the most commonly used sensors
For custom tuning of fusion filters, check out this guide.

Fig 5. Comparison of RMS error for basic velocity sensor estimates, with and without bias tracking. The graph on the left shows fluctuations in the ‘Basic Sensor Estimate,’ while the one on the right demonstrates improved accuracy with ‘Velocity Sensor Estimate With Bias Tracking’.
With MATLAB, you can:
- Use traditional filters like Kalman Filter (KF) and Extended KF (First applied at the NASA Ames Research Center for the Apollo Navigation Computer)
- Apply application-specific filters such as Attitude and Heading Reference Systems (AHRS)
- Configure outputs in both Euler and Quaternion formats
The decision of choosing the appropriate filters is often based on the application and sensors involved.
For help with choosing the appropriate filter, check out this table.
Why MATLAB for Inertial Navigation?
MATLAB stands out by offering a wide range of:
- Multiple sensor models to match your platform, including IMU, GPS, altimeters, wheel encoders, range sensors, and more
- Direct parameterization for users looking for more control and autotuning to reduce the development time
- Prebuilt algorithms and filters such as EKF, UKF, AHRS, and more, so you don’t have to worry about implementation and can focus on your application
By balancing between out-of-the-box algorithms and ease-of-use, MATLAB provides an adaptable and user-friendly environment for sensor fusion and INS simulation.
I hope you’re wondering now, “where can I find these capabilities within the MathWorks tools?” They are majorly available out of the following two toolboxes, MATLAB add-on products, and along with their additional benefits – they can be employed for different applications.
Navigation Toolbox
Along with the Inertial Navigation capabilities discussed above, Navigation Toolbox provides algorithms and analysis tools for motion planning, as well as simultaneous localization and mapping (SLAM). The toolbox includes:
- Customizable search and sampling-based path-planners, as well as metrics for validating and comparing paths
- Ability to create 2D and 3D map representations, generate maps using SLAM algorithms, and interactively visualize and debug map generation with the SLAM map builder app.
- Inertial Navigation System capabilities discussed above, as well as additional optimization-based algorithms for localization
Navigation Toolbox is intended for engineers working on navigation applications who would like to leverage the path planning and SLAM capabilities followed by their sensor fusion tasks.

Fig. 6 Autonomous Systems Development Workflow, highlighting the applications supported by Navigation Toolbox – Localization and Mapping
Sensor Fusion and Tracking Toolbox
While Navigation Toolbox provides both filter-based and optimization-based localization approaches to support localization and mapping applications, the Sensor Fusion and Tracking Toolbox focuses on supporting object tracking workflows by providing:
- Multi-object trackers and estimation filters for evaluating architectures that combine grid-level, detection-level, and object- or track-level fusion
- Metrics, including OSPA and GOSPA, for validating performance against ground truth scenes
- Additional sensor models such as infrared, radar, and lidar
Sensor Fusion and Tracking Toolbox is intended for engineers focused on object detection and tracking.

Fig. 7 Autonomous Systems Development Workflow, highlighting the applications supported by Sensor Fusion and Tracking Toolbox – Localization and Tracking
Both toolboxes include a range of examples and in-depth documentation to help you get started. While each toolbox has its own intended purpose, it is common for our customers to employ both toolboxes for their complete autonomous system development.
Check out what our customers are saying
Many organizations have successfully leveraged MATLAB’s capabilities in their projects. For insights into real-world applications, explore these user stories:
- Harvesting Driving Scenarios from Recorded Sensor Data at Aptiv
- Tata Motors Accelerates Development of Autonomous Vehicle Control Algorithms with Model-Based Design
Conclusion
MATLAB’s comprehensive suite for simulating, analyzing, and fusing sensor data streamlines the development of INS for various applications. By leveraging these tools, developers can enhance the accuracy and reliability of autonomous systems, aerospace platforms, AR/VR headsets, wearables, and other smart technologies.
Know more about Eric:
Eric is a Product Marketing Engineer at MathWorks. While completing his undergraduate degree in Aerospace Engineering and a minor in Computer Science from the University of Michigan, he interned with NASA Ames Research Center. During the internship he worked on the Distributed Spacecraft Autonomy Project to investigate how Inter-Satellite Links and Distributed Extended Kalman Filters could be used to create a Lunar Position, Navigation, and Timing system.


댓글
댓글을 남기려면 링크 를 클릭하여 MathWorks 계정에 로그인하거나 계정을 새로 만드십시오.