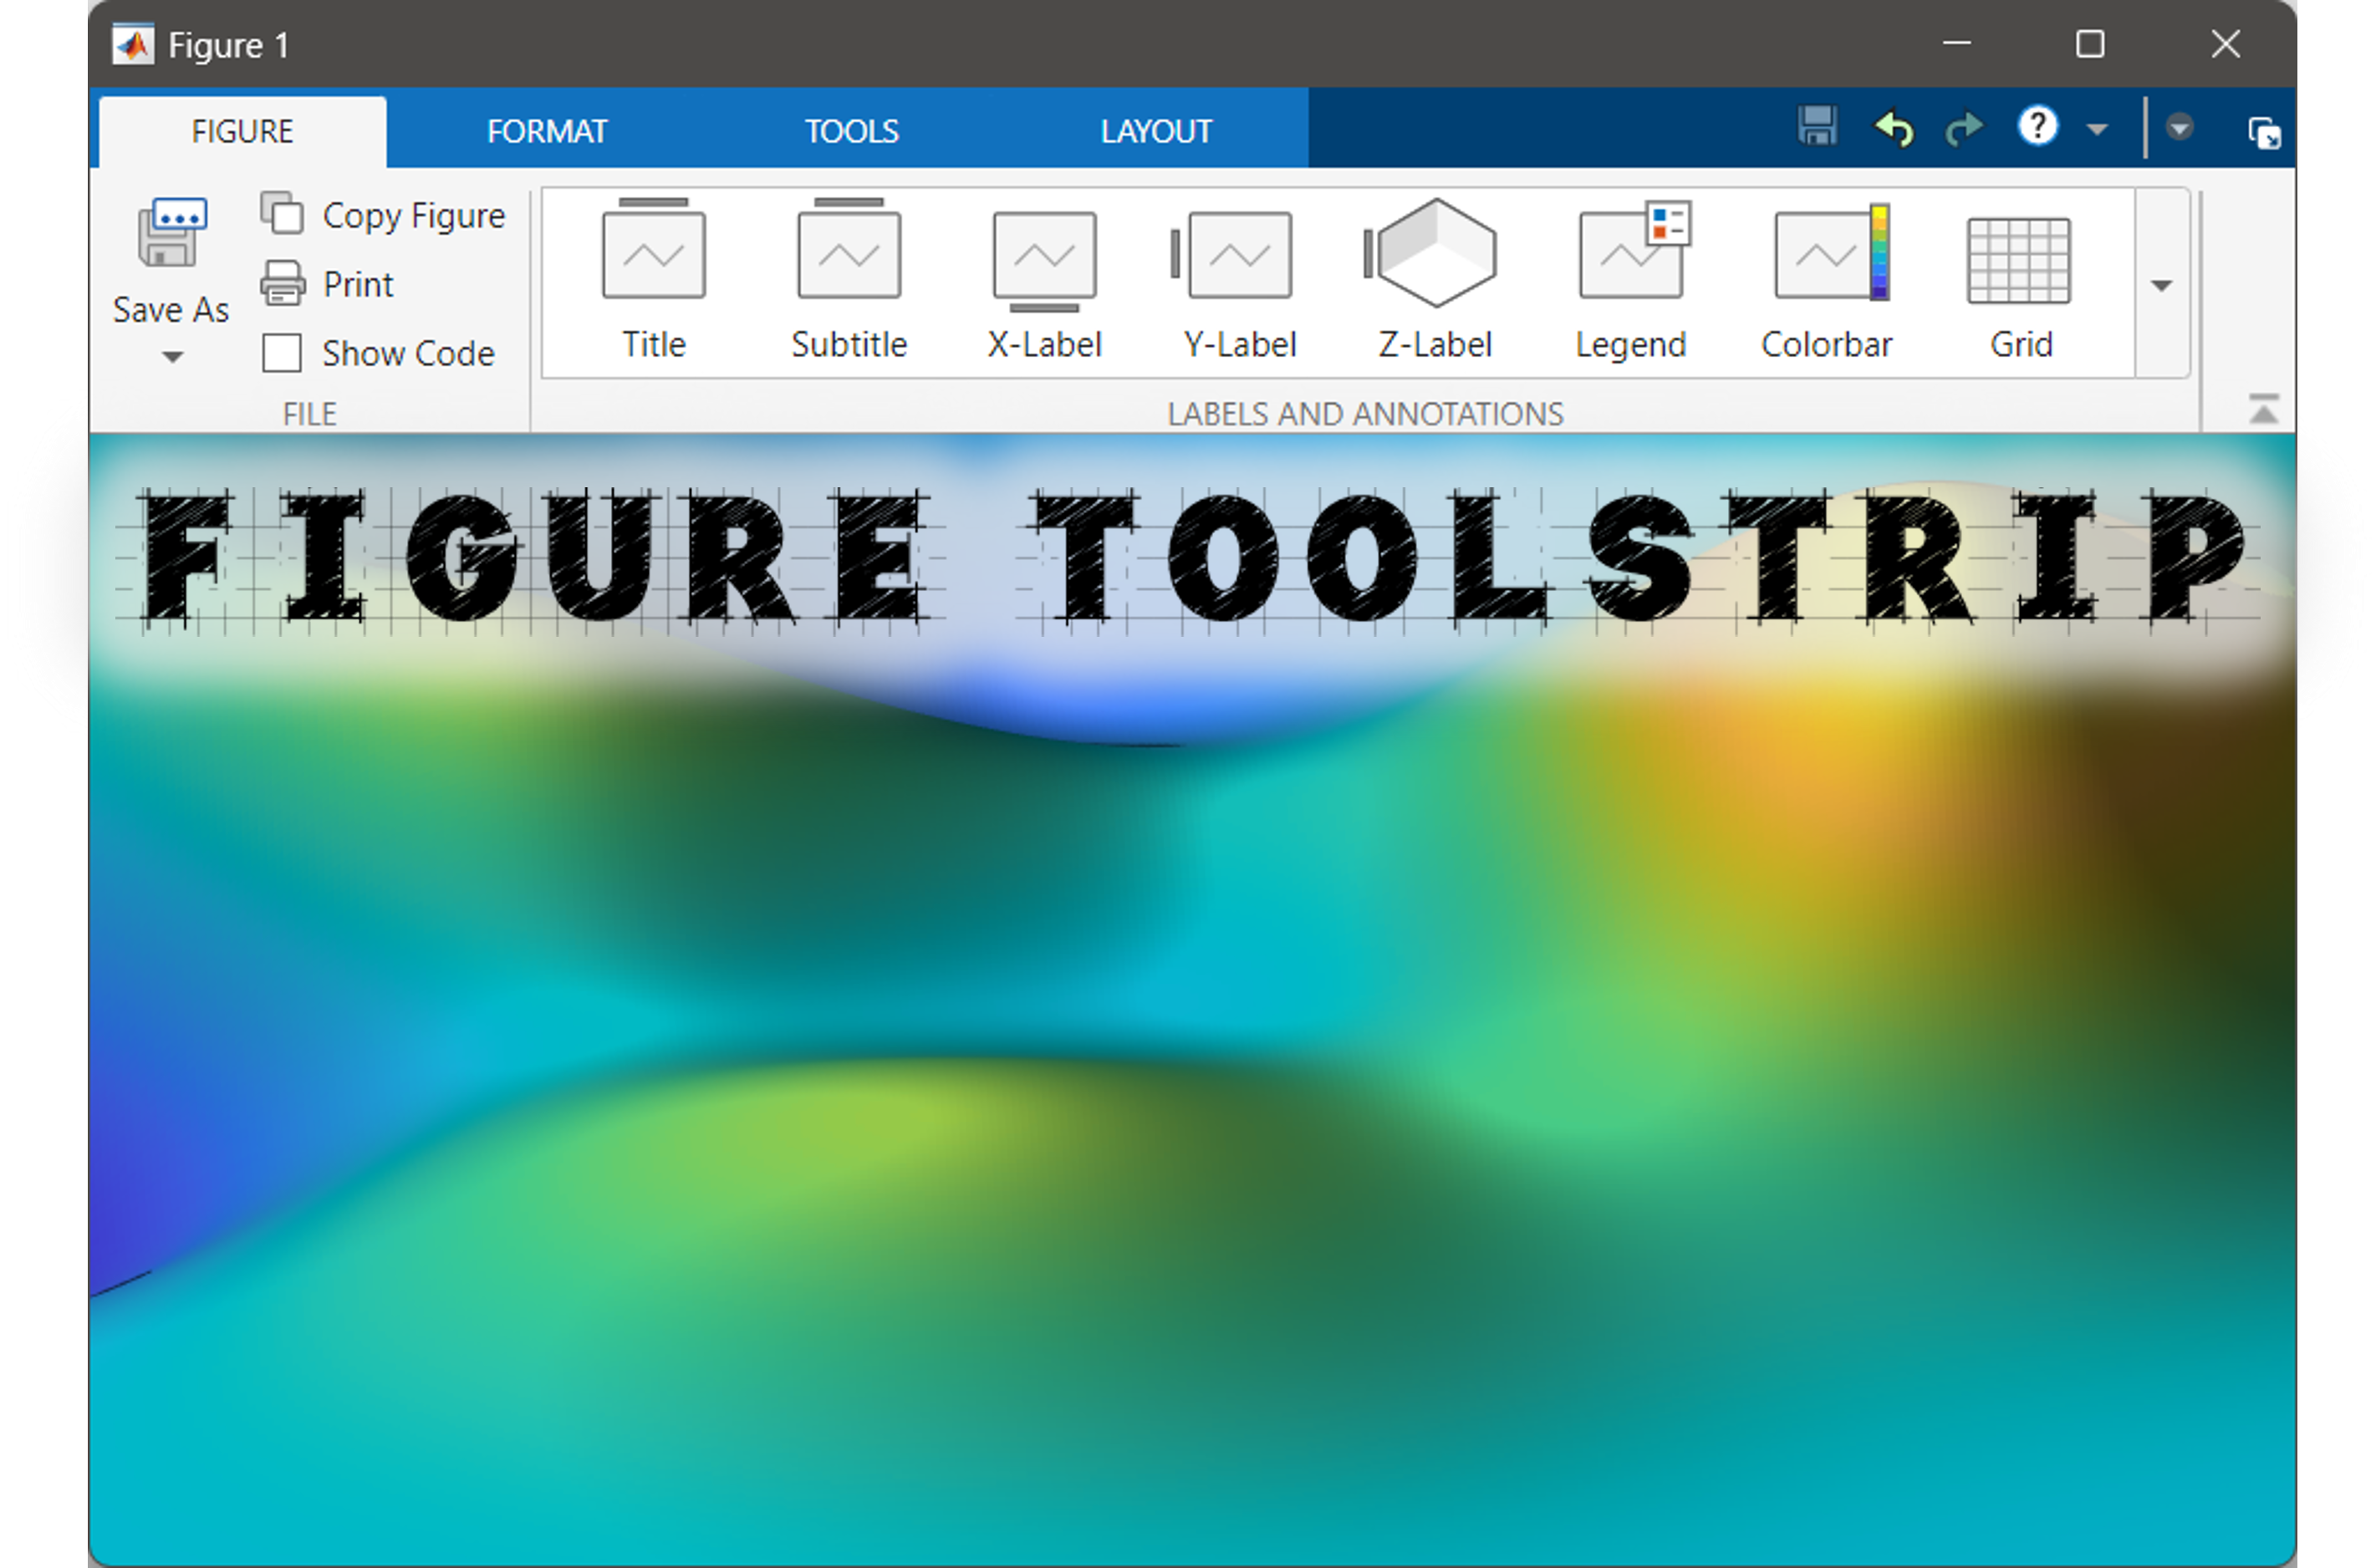
Guest Writer: Travis Roderick
Travis joined MathWorks in 2013, bringing experience from previous roles in software development across the healthcare, finance, and storage network industries. He... 続きを読む >>

Guest Writer: Travis Roderick
Travis joined MathWorks in 2013, bringing experience from previous roles in software development across the healthcare, finance, and storage network industries. He... 続きを読む >>
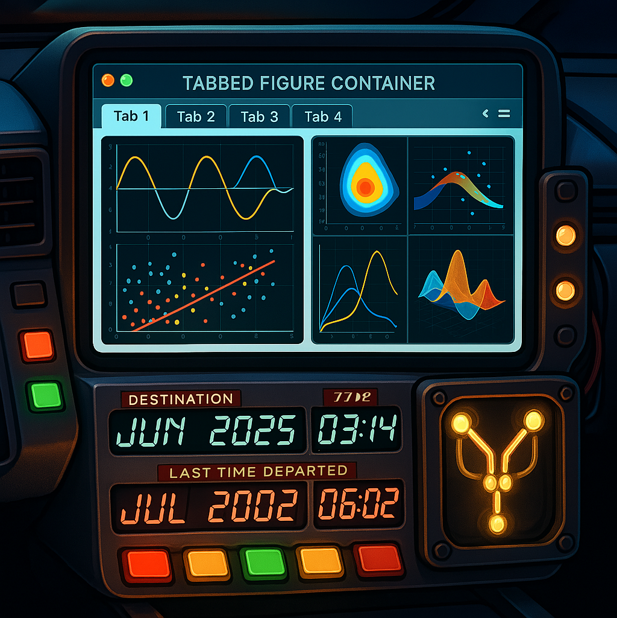
Guest Writer: Brian Knolhoff
Brian is a software engineer on the Figure Infrastructure and Services team at MathWorks. After first encountering MATLAB while calibrating radar systems, he now... 続きを読む >>

Guest Writer: Chris Portal
Chris Portal serves as director of engineering for the MATLAB graphics and app building teams, delivering data visualizations, app building capabilities, and data... 続きを読む >>
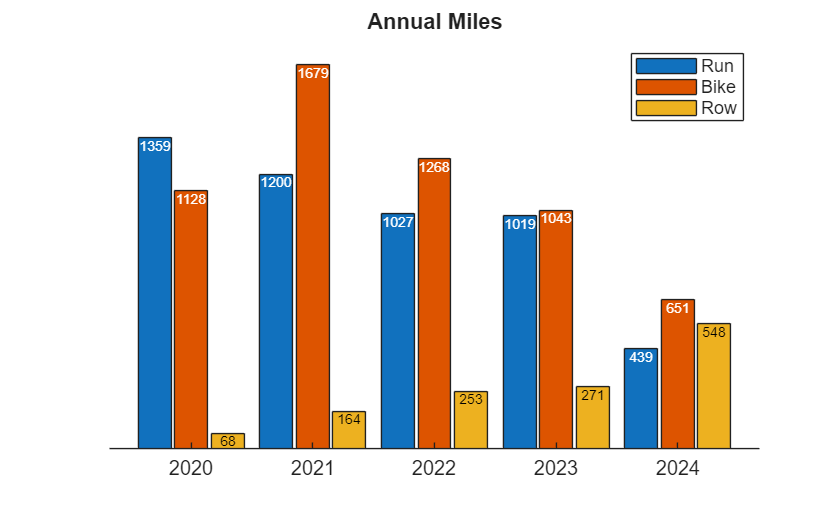
Guest Writer: Benjamin Kraus Ben has been a Software Engineer on the MATLAB Graphics and Charting Team since 2015. Although his first exposure to MATLAB was in 2000 as an undergraduate... 続きを読む >>
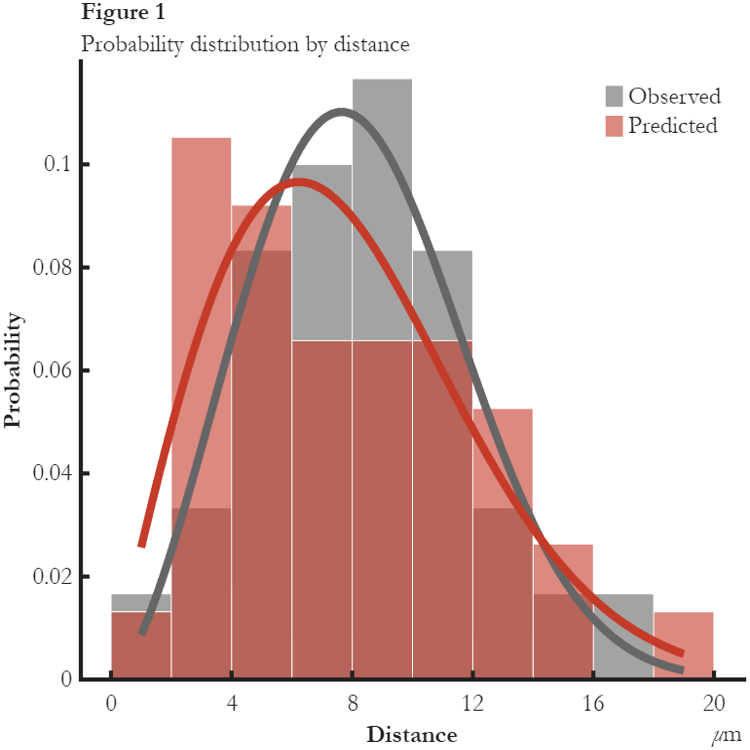
Guest Writer: Abby Skofield We're excited to welcome Abby Skofield back to the blog! Abby revisits the classic topic of "Making Pretty Graphs"—this time bringing a modern twist with some of... 続きを読む >>
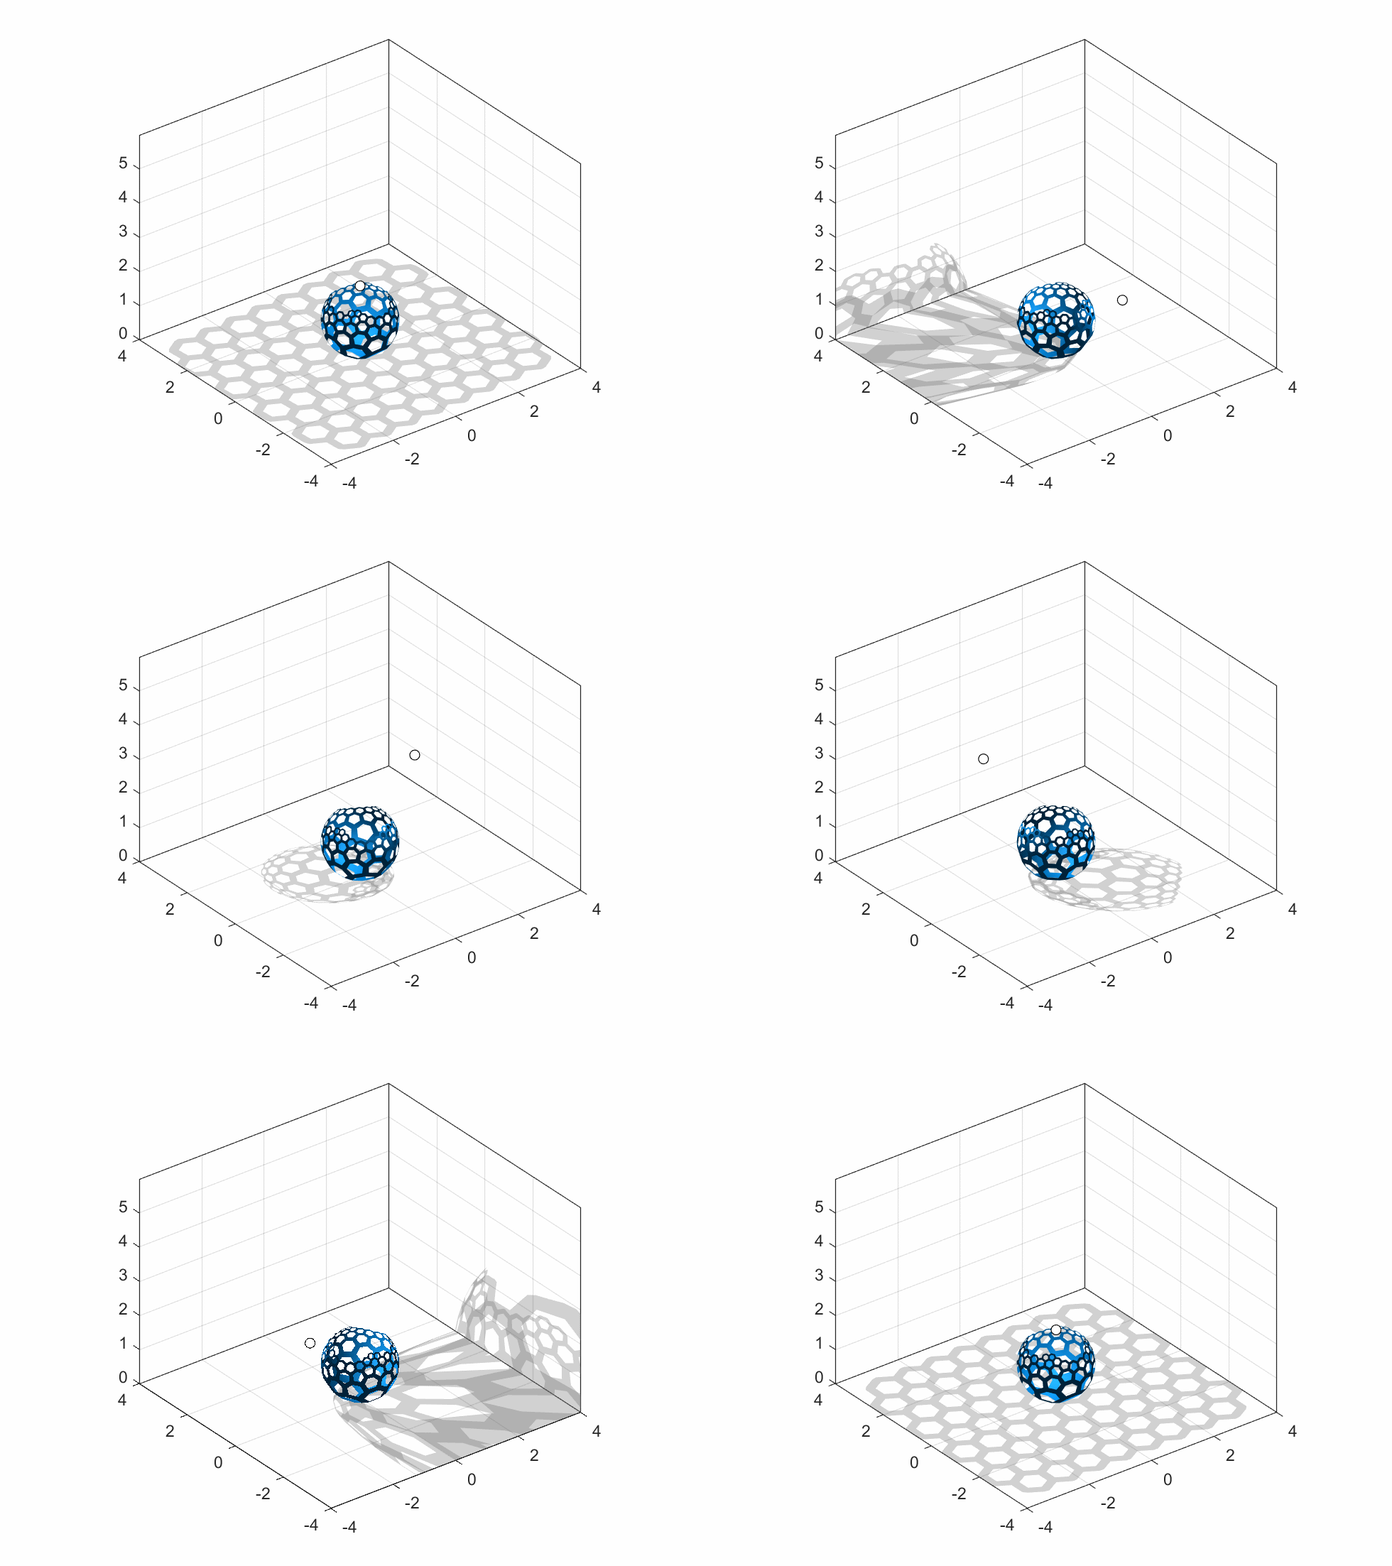
Guest Writer: Eric Ludlam Joining us again is Eric Ludlam, development manager of the MATLAB charting team. Discover more about Eric on our contributors page. In the previous... 続きを読む >>

Guest Writer: Eric Ludlam Joining us again is Eric Ludlam, development manager of the MATLAB charting team. Discover more about Eric on our contributors page. MATLAB Graphics... 続きを読む >>
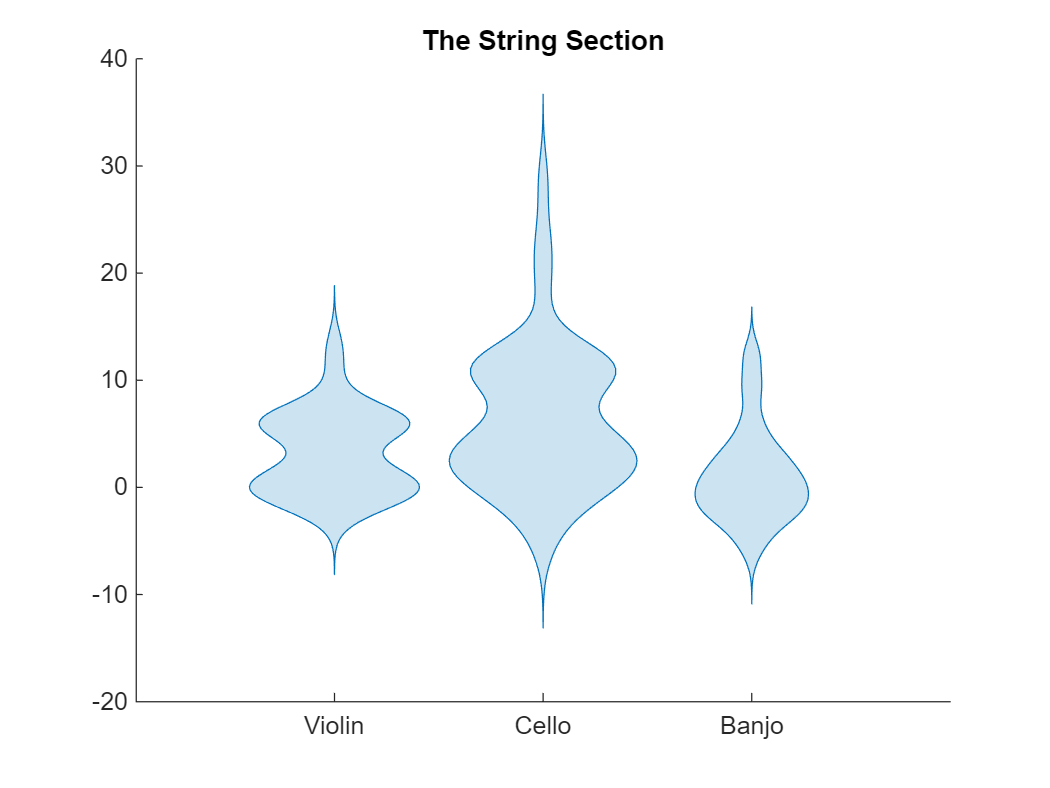
Guest Writer: Baldvin Einarsson Baldvin is a software engineer in the Statistics and Machine Learning Toolbox. His journey with MATLAB began in the early 2000s during his college years... 続きを読む >>