
Introducing the New Graphics and App Building System in MATLAB R2025a
 |
Guest Writer: Chris Portal Chris Portal serves as director of engineering for the MATLAB graphics and app building teams, delivering data visualizations, app building capabilities, and data exploration tools for MATLAB. Chris joined MathWorks in 1997 as a developer and has been involved in the development and evolution of several MathWorks products including MATLAB, Simulink, Partial Differential Equation Toolbox, and version 1.0 of Data Acquisition Toolbox, Instrument Control Toolbox, and Image Acquisition Toolbox in the test and measurement product area. |
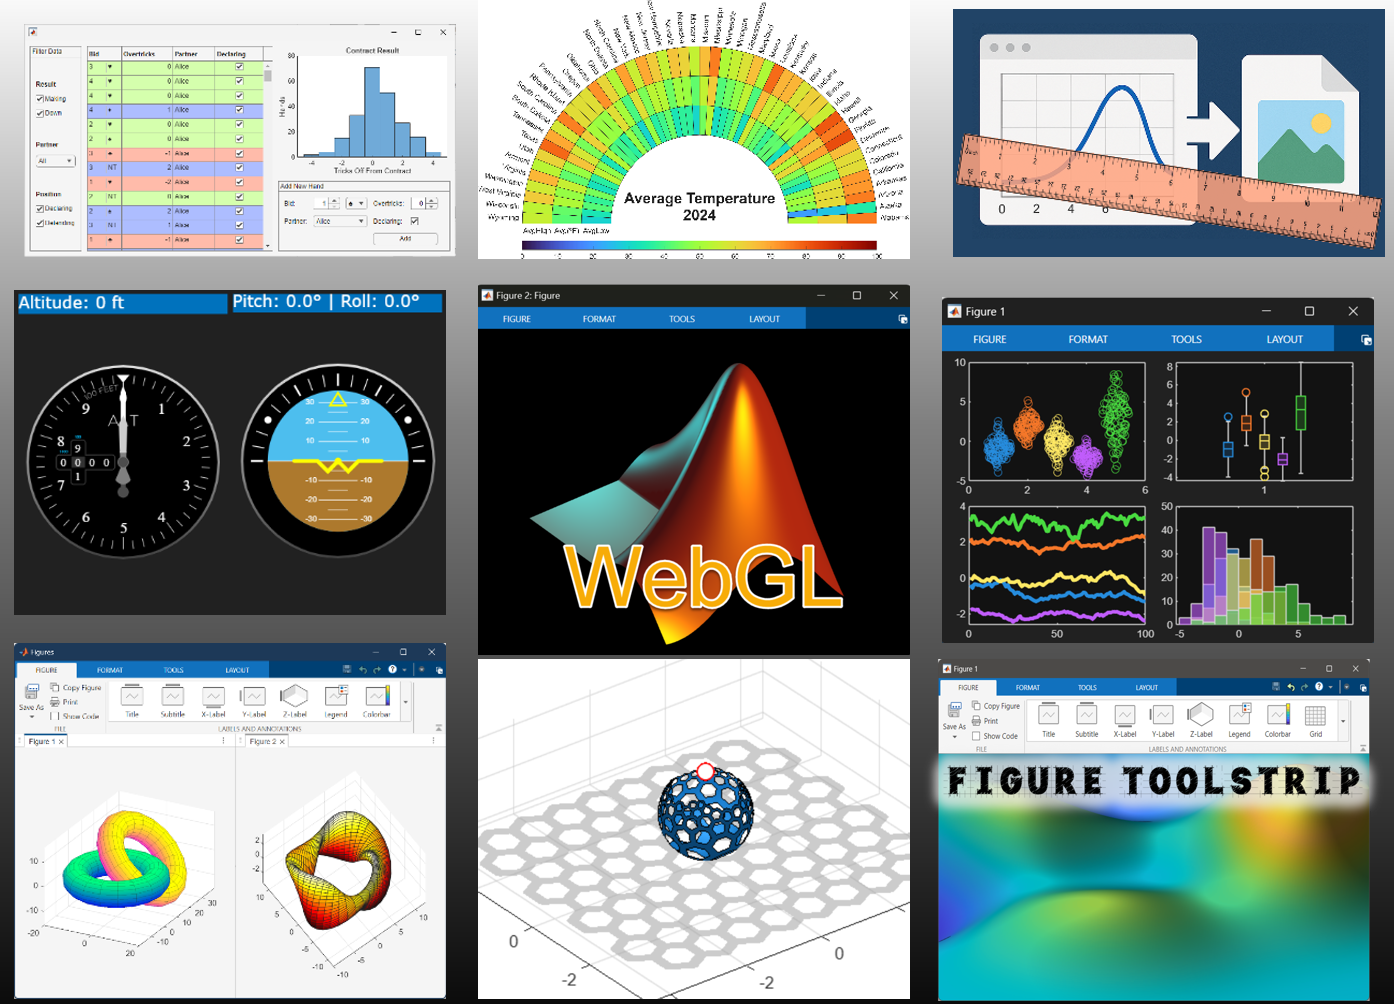
We are thrilled to announce a major update in MATLAB R2025a that marks a significant milestone in the evolution of our graphics and app building capabilities. This update transitions our system from a Java-based graphics rendering system to a WebGL-based one, bringing a host of improvements and new opportunities for our users.
Why the Change?
For over 20 years, our Java graphics system has served us well, but it has also accumulated technical cruft that hindered our ability to respond to user needs efficiently. The shift to WebGL technology is a game-changer. WebGL has proven to be significantly more robust, eliminating crashes associated with graphics drivers that were common in the Java system. This transition not only enhances stability but also lays the groundwork for exciting new web-based workflows. With full support for graphics and apps in MATLAB Online, the graphics system is positioned to enable future capabilities like sharing interactive charts over the web and more seamlessly deploying your apps to the web.
What’s New in R2025a?
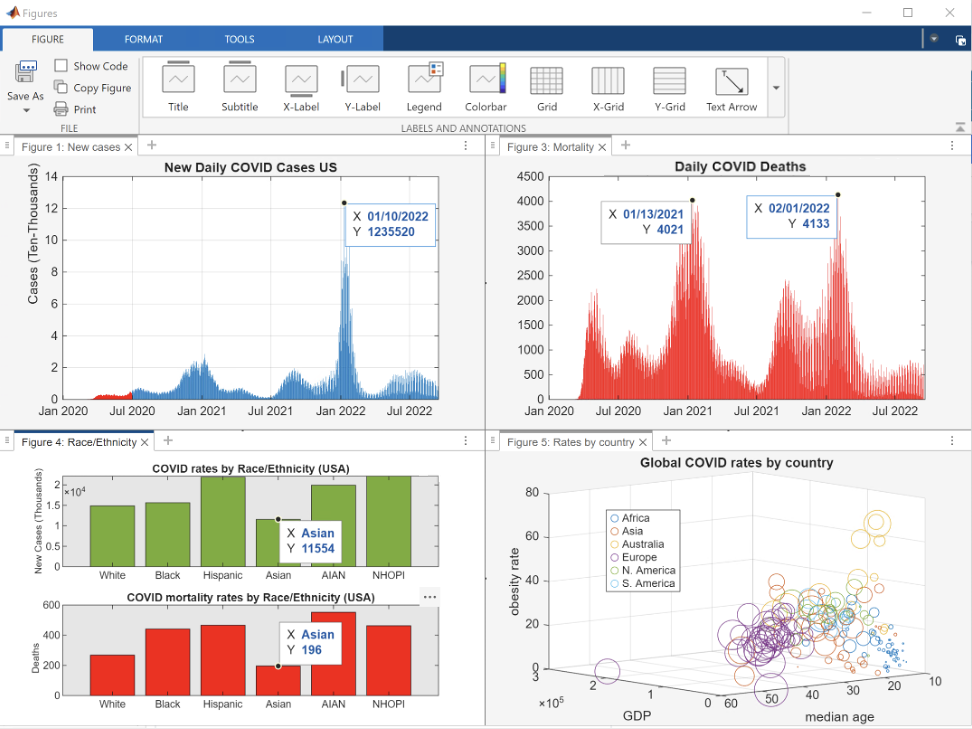
Tabbed Figures and Figure Container
Figures now open as tabs in a docked figure container in the MATLAB desktop by default. This new figure container allows you to organize, explore, customize, and generate code for figures more efficiently. You can view figures more easily with their larger default size and wider aspect ratio, customize the layout by rearranging tabs, and annotate figures using the toolstrip.
This new setup enables a more streamlined workflow for comparing multiple visualizations side by side, making it easier to iterate on designs, debug visual outputs, or present findings in a more cohesive and interactive way.
New Toolstrip for Figures
The updated system introduces a new toolstrip for figures, replacing the traditional file menus and toolbar. The old system's menus and toolbar were densely packed with capabilities that were hard to access or discover. The new toolstrip provides improved options for interacting with plots and data in a figure, making it easier to find and use the features you need.
This modernized interface enables a more intuitive, task-oriented workflow—whether you're customizing visual elements, exporting content, or generating code—helping both new and experienced users work more efficiently, with less mouse clicks, and without needing to memorize where features are buried.
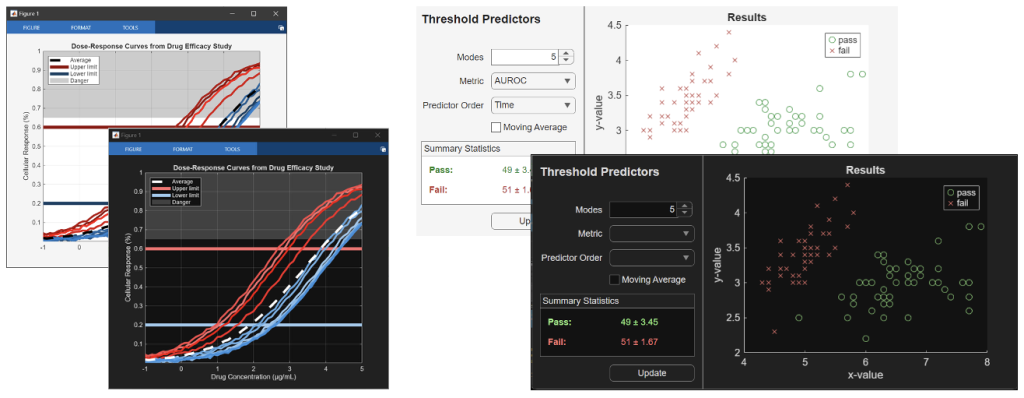
Graphics and App Theming
R2025a introduces the ability to create graphics and apps using light or dark themes. When you create plots or UI components with default colors, MATLAB automatically selects colors that are visually appealing for the chosen theme. This feature enhances the visual consistency and user experience across different environments.
This theming capability opens the door to building apps and visualizations that better align with user preferences or organizational branding, while improving readability and accessibility in both bright and low-light settings.
New App Building Capabilities
R2025a introduces several enhancements to app building that make it easier to create polished, modern, and accessible user interfaces. Apps now support light and dark themes, multiline content in table cells, and improved keyboard interactions across UI components. These updates not only improve usability but also help developers build apps that feel more integrated with the overall MATLAB environment and accessible to a broader range of users.
This release also marks the official retirement of GUIDE, MATLAB’s legacy app building tool, and the full transition to App Designer. App Designer offers a more modern, interactive design environment, richer component support, and a more scalable architecture—making it the preferred tool for building MATLAB apps going forward.
New Plotting Features
R2025a also brings a variety of new plotting enhancements, including:
- Polar Plots: Create patches and surfaces in polar coordinates.
- Violin Plots: Use additional grouping data options and customize color group appearance.
- Box Charts: Create box charts from table data and customize their appearance.
- Swarm Charts: Control jitter direction in swarm charts.
- Geographic Plots: Improved appearance of basemaps.
Accessibility Enhancements
And there’s more. The new system is designed with accessibility in mind, making charts and app building components more screen reader and keyboard accessible. This compliance with accessibility standards ensures that MATLAB is more inclusive, allowing users with disabilities to interact with and benefit from our tools more effectively.
Performance and Readiness
At the heart of the graphics system lies an extensive network of functions and objects that enable countless configurations—shaping how millions of users interact with MATLAB every day. Balancing seamless performance with continuous refinement to support future growth has been a central focus of our work.
Our journey toward this new system began with a limited version first introduced through App Designer workflows in R2016a. Since then, each release has brought incremental improvements in both capability and performance. In preparation for R2025a, we partnered with dozens of companies to evaluate the graphics codebases and sophisticated apps they rely on daily. Through these collaborations, and extensive usability assessments, we ensured that critical workflows perform at acceptable levels and gained valuable insights into how the system is used in real-world scenarios.
From these engagements, we’ve learned that while the system is ready for broad use today, there’s a wide range of usage patterns: some benefit from adopting new programming approaches and solutions we’ve introduced, while others are areas we continue to optimize. These insights have been instrumental—not only in guiding our optimization efforts, but also in helping users write cleaner, more maintainable, and robust code. We’ve distilled these learnings into a set of best practices to help you get the most out of the new system for your graphics and apps.
Although the system is ready for widespread adoption, we’re just getting started. The new WebGL-based graphics system opens the door to leveraging modern web technologies for continued enhancements—with more improvements already planned for R2025b, R2026a, and, where possible, backported into R2025a Updates.
Looking Forward
This is just the beginning. In the coming months, we will be publishing a series of blog posts covering the various new capabilities of our graphics and app building system. We will provide guidance and resources on how to best leverage these changes and address any areas that may require adjustment. Make sure to follow the Graphics and App Building blog so you don’t miss a post!
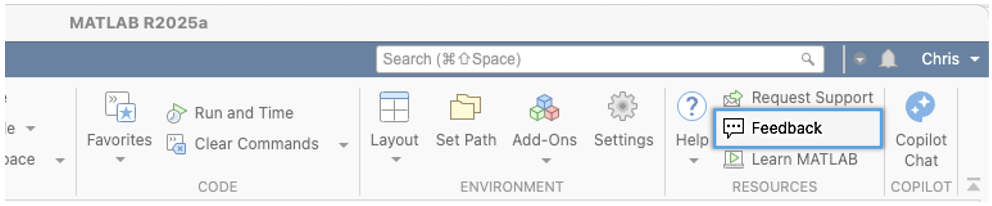
We are excited about the opportunities these changes represent and are committed to supporting you through this transition. Give the new system a try and let us know what you think using the new feedback button in the MATLAB Desktop. This feedback goes directly into a dashboard our development teams are monitoring to identify trends or immediate actions to take. Your feedback is invaluable in helping us continue to refine and enhance MATLAB.


Comments
To leave a comment, please click here to sign in to your MathWorks Account or create a new one.