
An Accessible & Modern Axes Toolbar
 |
Guest Writer: Jessa Karlberg Jessa is a software engineer on the Graphics Interactions and Accessibility team at MathWorks. After years of creating her own charts and data visualizations, she now develops tools to help others do the same, with an eye to interactive design and user experience. When she’s not coding, she enjoys drinking way too much tea and knitting copious quantities of hats. |
The axes toolbar was introduced in MATLAB R2018b as a way to show useful controls and tools right next to the axes, where those tools are relevant. The toolbar gives users finer-grained control over interactions that are enabled on axes by default, like zooming and data brushing. The toolbar also helps chart creators provide custom functionality in a consistent and predictable place.
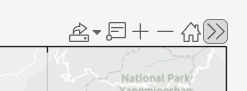
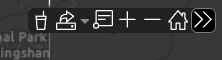
Over the years, we noticed opportunities to improve the axes toolbar experience—particularly for people using touchscreens, keyboard navigation, and screen readers. That’s why, in R2026a, we updated the toolbar to make it more accessible for more users! The toolbar now starts collapsed as a single button, which is always visible. All interactions with the toolbar, such as displaying the toolbar or drop-down items, are click-based rather than hover-based, which greatly improves accessibility and gives users explicit control over when and how the toolbar appears.
|
|
|
|
Before R2026a
|
R2026a
|
The refreshed toolbar meets Web Content Accessibility Guidelines, which means that users can now use tab and arrow keys to navigate with their keyboard, get helpful hints about button functionality by listening to a screen reader's descriptions, and have a high-quality experience on touchscreens, where hover isn't straightforward but clicking is simple and fully supported.
In addition to improved accessibility, the toolbar has improved performance, as well as several exciting new updates to give users even more control over their experience. I'll walk through a handful of these updates and share some tips and tricks for working with the axes toolbar.
Expand an axes toolbar
I happen to love bubble tea, also known as boba, and on a recent trip to Taiwan—the birthplace of bubble tea—a friend challenged me to try one new bubble tea shop each day. I was happy to embrace the challenge, but as I went, I realized I could have benefited from being a bit more systematic in my approach.
When I got back home, I decided to create a simple tool that would have helped me track my bubble tea adventures. To begin, I decided my boba tool would display a map to keep track of all the bubble tea shops I had visited. Something like this:
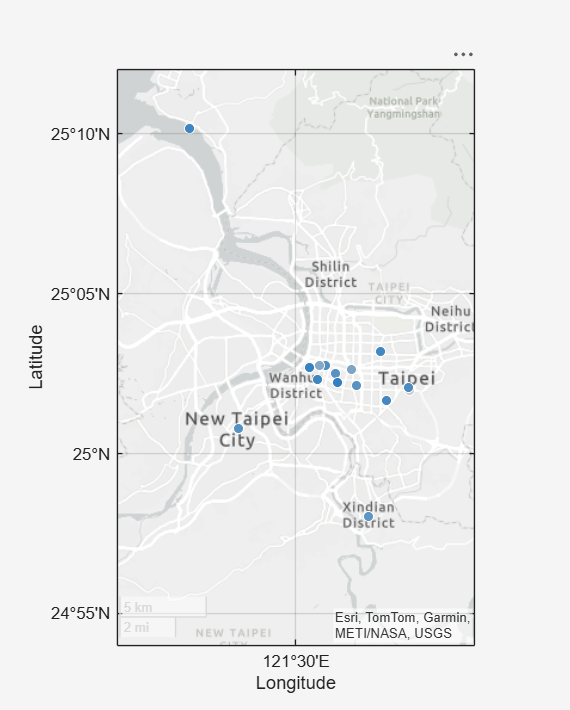
Next, I wanted a way to easily add new shops as I tried them. What if I added a button to the axes toolbar to provide this functionality? Default axes toolbars aren't meant to be customized, but it's easy to create a custom axes toolbar with all the same buttons. Because my custom axes toolbar is important for my boba tracking tool, I made the toolbar fully visible from the start by setting the toolbar's new Expanded property.
ax = gca;
tb = axtoolbar(ax,"default");
tb.Expanded = "on";
Particularly in charts with important custom functionality accessible through the toolbar, expanding your axes toolbar improves discoverability and helps users immediately begin to interact with your chart.
Note: If you want the axes toolbar to always begin as expanded on all charts, you can use default property values:
set(groot,"defaultAxesToolbarExpanded","on")
Make accessible and scalable buttons
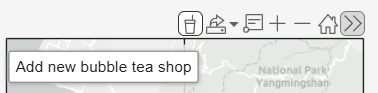
As an easy entry point to my “add a new bubble tea shop” interaction, I added a custom button with my desired functionality. As of R2026a, toolbar button icons can now be SVG images, which look much clearer and crisper, and scale better across different resolutions and displays than PNGs or other image types. To support accessibility, it's also important to specify a tooltip, so screen readers can provide information about a button's purpose to users (as of R2026a).
So, I made sure to use an SVG version of my bubble tea icon and to set descriptive tooltip text:
Download the svg file
Download the svg file
btn = axtoolbarbtn(tb,"state", ...
Icon="tea.svg", ...
Tooltip="Add new bubble tea shop", ...
ValueChangedFcn=@btnCallback);
Move a toolbar inside a chart
I wanted to make the map really big and fill most of the figure so that I could maximize the space to show as many bubble tea shops as possible. But I didn’t want the toolbar to disappear off screen. In R2026a, axes has a new ToolbarLocation property, which I used to position the toolbar "inside" the axes rather than its default "outside" position.
ax.ToolbarLocation = "inside";
Now, if I click the button, I’m able to add a bubble tea shop, record how much I liked it so I can easily find my favorites later, and see it show up on my nice large map for future reference:
Adjust for dark theme
What if I use this tool at night and the light background strains my eyes? As of R2025a, figures can be put into dark theme! Default toolbars automatically work with dark theme, but to make your new custom button look its best, you can simply listen for the figure's theme change and swap out your button’s icon when in dark theme.
Download the svg files
Download the svg files
f = gcf;
f.ThemeChangedFcn = @(obj,evd) swapIcon(evd.Theme,btn);
function swapIcon(newTheme,btn)
if strcmpi(newTheme.BaseColorStyle,"light")
btn.Icon = "tea.svg";
else
btn.Icon = "tea-dark.svg";
end
end
Check out our guide to themes for chart and app creators to learn about creating theme-friendly charts and apps.
Share a toolbar across multiple axes
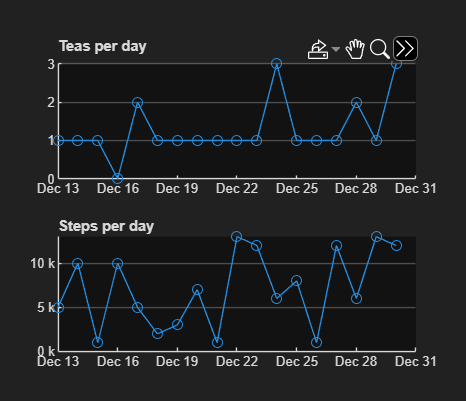
A bit into my visit, I started to get worried about my sugar intake and decided to check whether I was getting sufficient exercise to offset my tea consumption. To help with this sort of analysis, I added a couple plots to my boba tool that let me compare my bubble tea intake to my daily steps walked.
Because each axes doesn't need its own toolbar, I assigned a shared axes toolbar to the tiled layout, before creating the axes. A shared toolbar makes it easier to control both charts with a single click, slightly improves startup time of my tool as the individual axes don't need their own separate toolbars, and let users customize which buttons are relevant to their situation.
Additionally, to further improve pan and zoom interactions between the two axes, I linked their x limits together to ensure the dates always line up. I also used the InteractionOptions property of the axes to limit panning and zooming to the x dimension so that I could explore the data for different time periods but keep the y limits unchanged.
tl = tiledlayout;
sharedToolbar = axtoolbar(tl,{"pan","zoom","export"});
a1 = nexttile;
a2 = nexttile;
linkaxes([a1 a2],"x");
a1.InteractionOptions.LimitsDimensions = "x";
a2.InteractionOptions.LimitsDimensions = "x";
Remove a toolbar
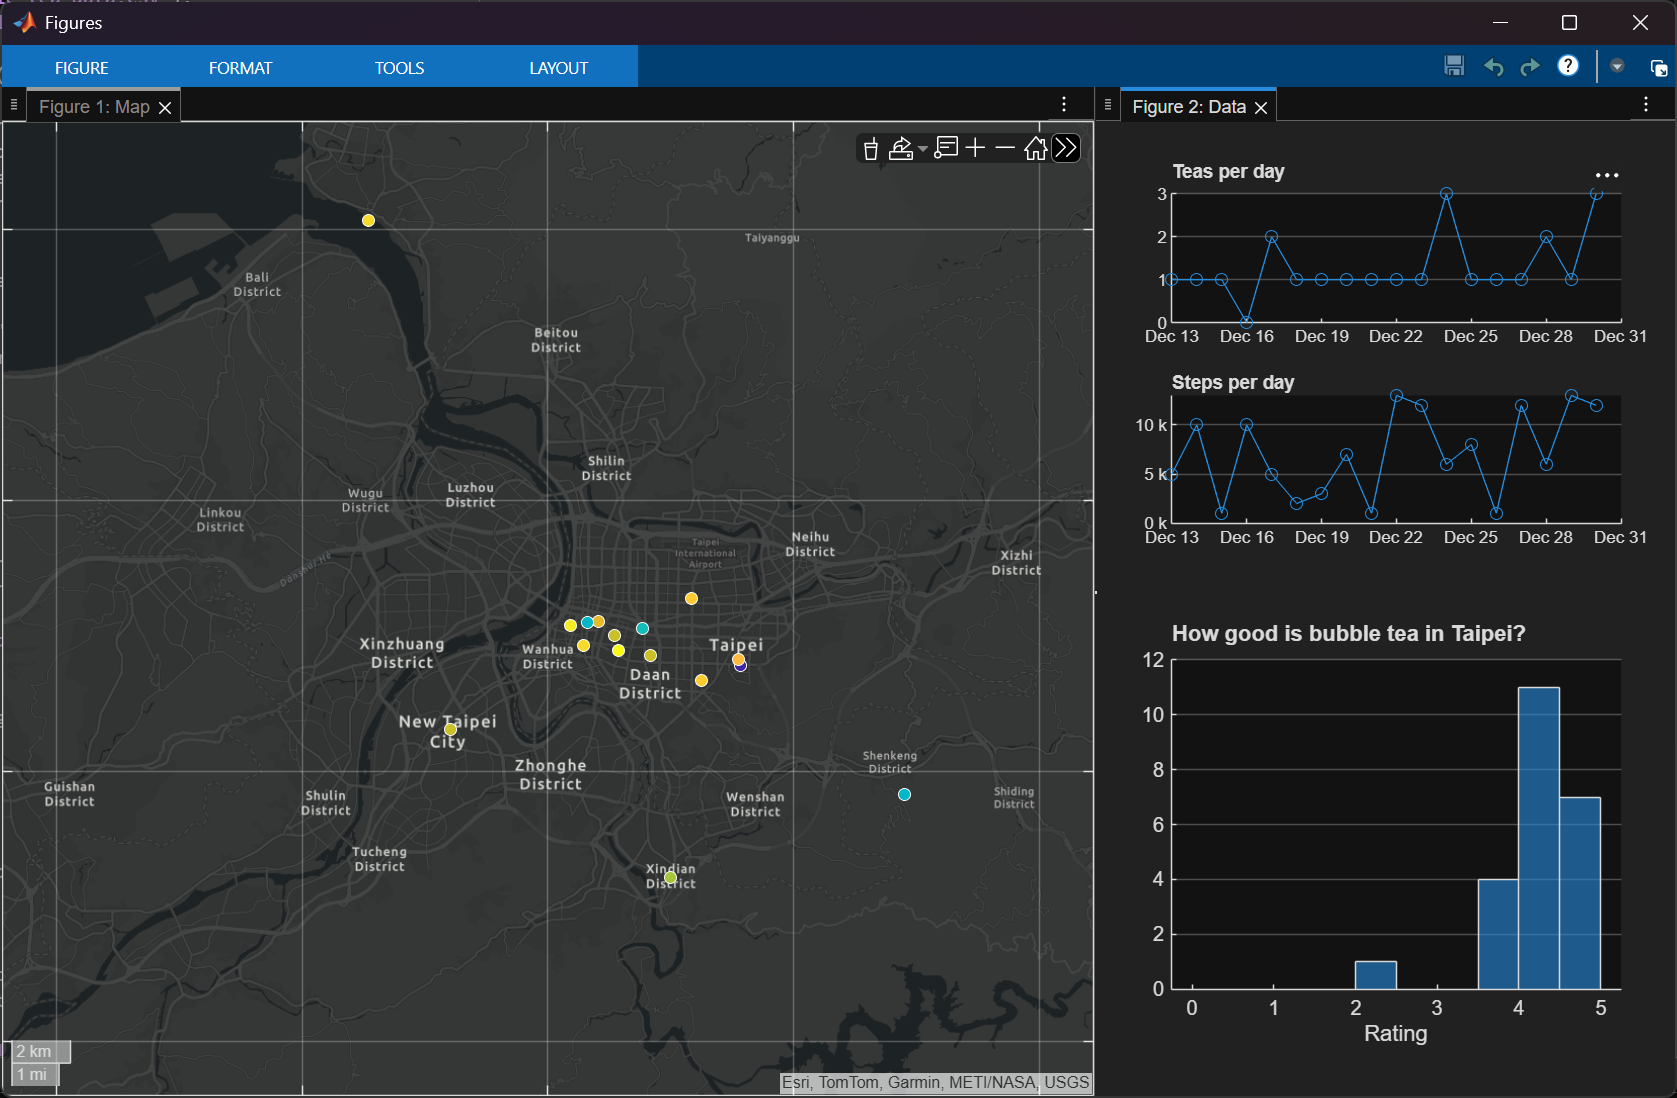
After drinking a bunch of boba, I got curious about how ratings varied between shops and decided to add a histogram. There's no need to have any interactions besides data tips on this histogram, so I set data tips as the only allowed interaction and completely removed the axes toolbar to visually tidy things up and slightly boost my tool's startup time.
ax = gca;
ax.Interactions = dataTipInteraction;
ax.Toolbar = [];
To learn more about customizing and optimizing interactions, check out Will's article about the new interactions system.
Pin a toolbar to the figure
Finally, what if I fell in love with one particular bubble tea and couldn't stop thinking about it? To capture my favorite bubble tea of all time, I created a 3D model so that I could remember every detail of the experience. I enabled camera interactions on my model, like those used in world-building charts, so my axes changes size as I interact. After enabling orbit mode in the camera tab of the figure's toolstrip, I pinned the axes toolbar to the edge of the figure using the new ToolbarLocation property so I could always find it in a consistent location and it's not bouncing around with the axes.
ax = gca;
ax.ToolbarLocation = "container";
|
|
|
|
Default location (relative to axes)
|
Custom location (relative to figure)
|
Note: This "container" location is only intended to host the toolbar of one axes.
Wrap up
That's probably enough bubble tea for one day! I hope these tips help you get the most out of the updated, more accessible, and modern version of the axes toolbar.
If you're interested in taking a closer look at any of the bubble tea related code, check out these files available in our repository:
- "Bubble Tea app.m" (along with the icons and data files)
- "3D boba model.m"


See Also
-
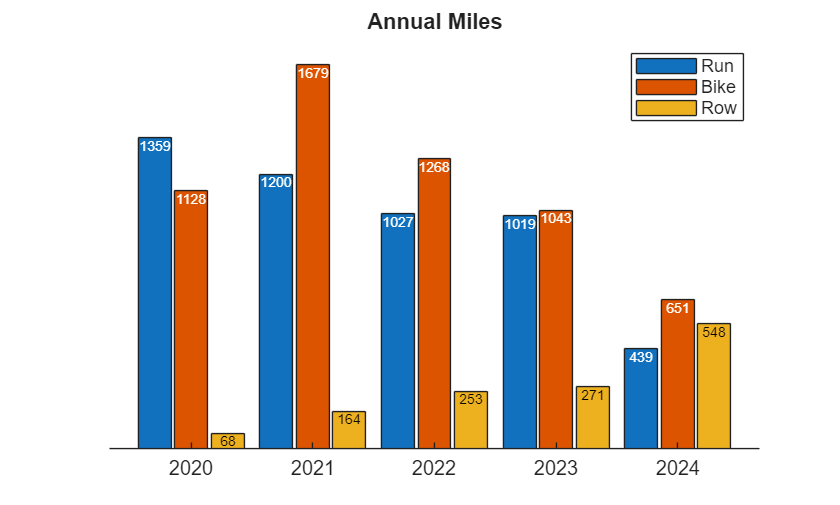
Labeling Bars Made Easy
Blogs
-
-
-


评论
要发表评论,请点击 此处 登录到您的 MathWorks 帐户或创建一个新帐户。