Today's post departs from image processing, my usual subject. Instead, I want to tell you about something that I just put up on GitHub and the MATLAB File Exchange. Earlier this year, I was debugging some code, and I wanted to know what was happening inside a certain function while the function was running. Typically, the way to do this is to modify the code by adding something like a call to disp:
But modifying the code is often undesirable. You have to remember to restore the code to its original state when you are done, and you might be working with code that is stored in a read-only location.
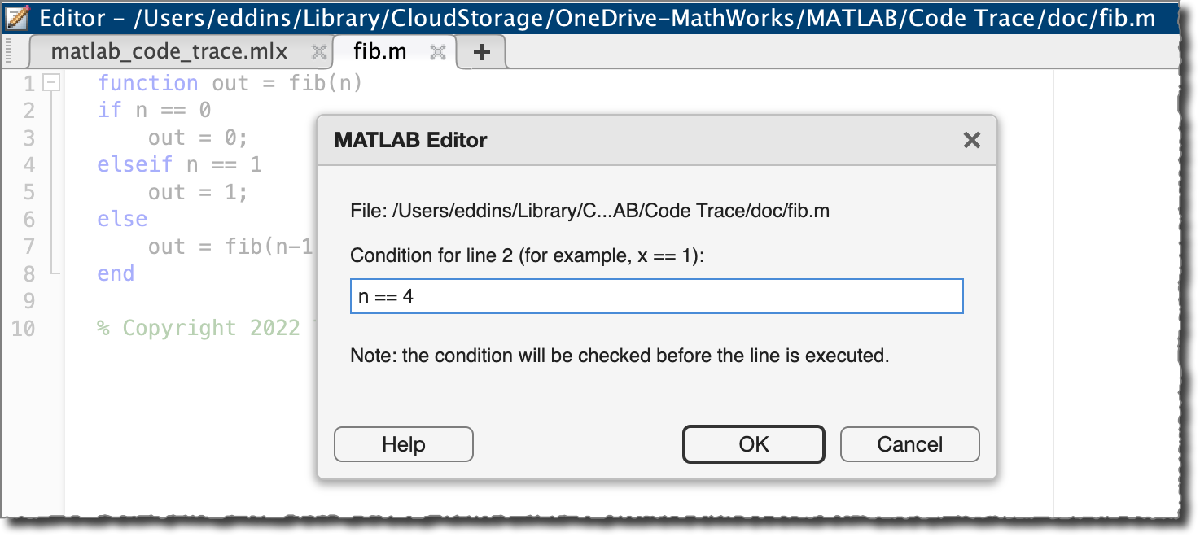
So, I started tinkering with ways to achieve a similar effect while leaving the code untouched, and I hit on the notion of using conditional breakpoints. When you set a conditional breakpoint on a code line in a file, then code execution stops at that line if an expression that you specify evaluates to true (1). Here is a screenshot of setting a conditional breakpoint using the MATLAB Editor. Here, I'm creating a breakpoint that will stop execution at line 2 of fib.m if the value of n is 4.
Well, we can use this to replace our use of disp if we can create an expression that:
- Always returns false (0)
- Has a side effect of printing information to the command window
That's the basis for my Code Trace for MATLAB, which is available on github.com/mathworks as well as on MATLAB File Exchange. Let me illustrate it using this function fib, which is a recursive implementation of a Fibonacci number generator. For the simplest example, I'll add a code trace by specifying the function name and the line number.
Now, a "trace" message will get displayed in the Command Window every time line 2 is about to be executed. To demonstrate, I'll call fib:
result = fib(3)
[trace] fib:2
[trace] fib:2
[trace] fib:2
[trace] fib:2
[trace] fib:2
result = 2
In each trace message, you see the function that is called, fib, and the line number that is about to be executed, 2. The level of indentation varies with the depth of the call stack, which helps us to visualize the recursive nature of this function.
For my next example, I'll display the value of n each time line 2 is about to executed.
addCodeTrace("fib",2,Expression = "n")
result = fib(3)
[trace] fib:2 n = 3
[trace] fib:2 n = 2
[trace] fib:2 n = 1
[trace] fib:2 n = 0
[trace] fib:2 n = 1
result = 2
I can also display a label. For my last example, I'll create several code traces that collectively show several details about the function fib as it executes.
addCodeTrace("fib",2,Label = "function entry", Expression = "n")
addCodeTrace("fib",7,Label = "recursive function call")
addCodeTrace("fib",3,Label = "function exit, returning 0")
addCodeTrace("fib",5,Label = "function exit, returning 1")
result = fib(4)
[trace] fib:2 function entry n = 4
[trace] fib:7 recursive function call
[trace] fib:2 function entry n = 3
[trace] fib:7 recursive function call
[trace] fib:2 function entry n = 2
[trace] fib:7 recursive function call
[trace] fib:2 function entry n = 1
[trace] fib:5 function exit, returning 1
[trace] fib:2 function entry n = 0
[trace] fib:3 function exit, returning 0
[trace] fib:2 function entry n = 1
[trace] fib:5 function exit, returning 1
[trace] fib:2 function entry n = 2
[trace] fib:7 recursive function call
[trace] fib:2 function entry n = 1
[trace] fib:5 function exit, returning 1
[trace] fib:2 function entry n = 0
[trace] fib:3 function exit, returning 0
result = 3
Clean up.
I'm interested to see whether people find this useful. Post a comment here if you have thoughts. If you encounter a problem or have a suggestion, feel free to create an issue on the GitHub repository.


コメント
コメントを残すには、ここ をクリックして MathWorks アカウントにサインインするか新しい MathWorks アカウントを作成します。