
Agentic AI for Climate Data in MATLAB

Guest blogger: Kostas Leptokaropoulos
Kostas is the MathWorks Geoscience Academic Manager, supporting Geoscience researchers and educators. He is also a visiting lecturer at Aristotle University of Thessaloniki (AUTH).
In this blog, he describes his experience working with Agentic AI for geoscience data.
I have been experimenting with coding Agents for my geoscience data
If you’re not familiar with Agentic AI yet, this resource [Guide to Agentic AI with MATLAB and Simulink] gives some useful background.
When I approach geoscience problems, I often do so by building computational tools. These tools let me interact with the data and draw scientific conclusions. They also let colleagues who are less familiar with programming do the same.
If you’ve ever been the “computation person” in your lab, you’ll know that developing such tools can take hours, or even days! Using an Agent, I can speed up the process of creating these custom tools. That lets me (and my colleagues) spend more time thinking about the science rather than the coding.
My goal is to build a climate data app
A lot of my colleagues often want to interface with data, but don’t want to directly interact with the code. So for my work, building apps like this is common practice.
Before I even start building it, I already have a clear idea in my mind what the end state looks like and I am accelerating the development process with Agentic tools.
What I want to get is a visual interface where I can import and visualize climate data and export my selections at the end.
I downloaded climate data from Copernicus in NetCDF (.nc) format and saved the folder into my working directory as “Copernicus_Data”: ORAS5 global ocean reanalysis monthly data from 1958 to present. This data contains information on global ocean and sea-ice reanalysis. If you want to learn more about NetCDF, this is a useful resource.
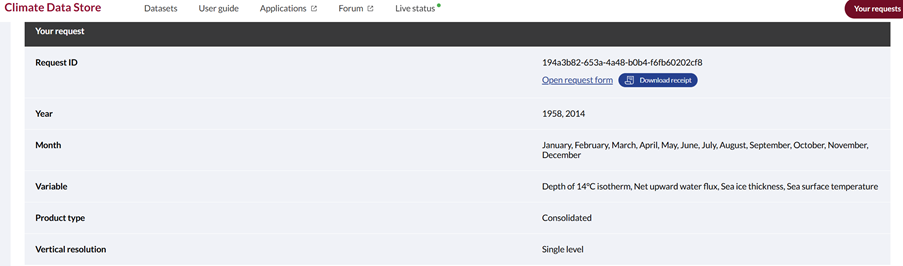
Normally, I would first inspect the NetCDF structure, identify the relevant variables and dimensions, write the code to read and visualize them, add controls for interactive exploration, and then refine the figures and export workflow. None of these steps is particularly unusual, but putting them together into a useful tool takes time. For me, MATLAB is a natural environment for this work because I can explore the data, analyze it, visualize it and build an interactive workflow all in the same place. These are some of the functions I normally use for working with netCDF [netCDF – Functions].
In this experiment, I wanted to see how much of that implementation work I could automate using a coding Agent (I am using Codex, but other Agentic tools can work too) while keeping control of the scientific choices myself. Because the Agent is working directly with MATLAB, I can build upon the tools and functions I already use, while still ending up with MATLAB code that I can inspect, modify and rerun. For this functionality I am using MATLAB Agentic Toolkit.
Teaching my Agent how to do Geoscience in MATLAB
I created a markdown file (init.md) in which I outlined:
1) General approach 2) MATLAB execution 3) netCDF conventions 4) what the deliverable should be
I highlighted key MATLAB functions that I know will be useful, what type of projection to use, as well as naming conventions.
- Use ncinfo to identify variables and dimensions.
- Use ncread for data and coordinate variables.
- Prefer geoplot, geoscatter, imagesc, surfm, or other installed MATLAB mapping functions as appropriate.
- Use the Robinson projection
- Assume files follow their existing naming convention unless inspection shows otherwise.
The key point is I am providing the Agent my knowledge of the tools and the field of study rather than letting it reinvent the wheel at every step
Prompt 0: “Read and understand the init.md file.”
Exploring and visualizing the data
Then, I started by:
Prompt 1: “Inspect the NetCDF datasets in the @Copernicus_Data Directory. Generate and execute the MATLAB live script (.m file) to select from a dropdown menu Month and Variable. Then plot on two maps the selected variables for 1958 and 2014.”
This is representative of a task I often have when working with environmental data: I have the files, but first I need to understand their structure and then turn them into something I can explore. Instead of specifying every MATLAB function and every step, I describe the result I want. The resulting Live Editor workflow lets me select a month and a variable and compare the data for 1958 and 2014. 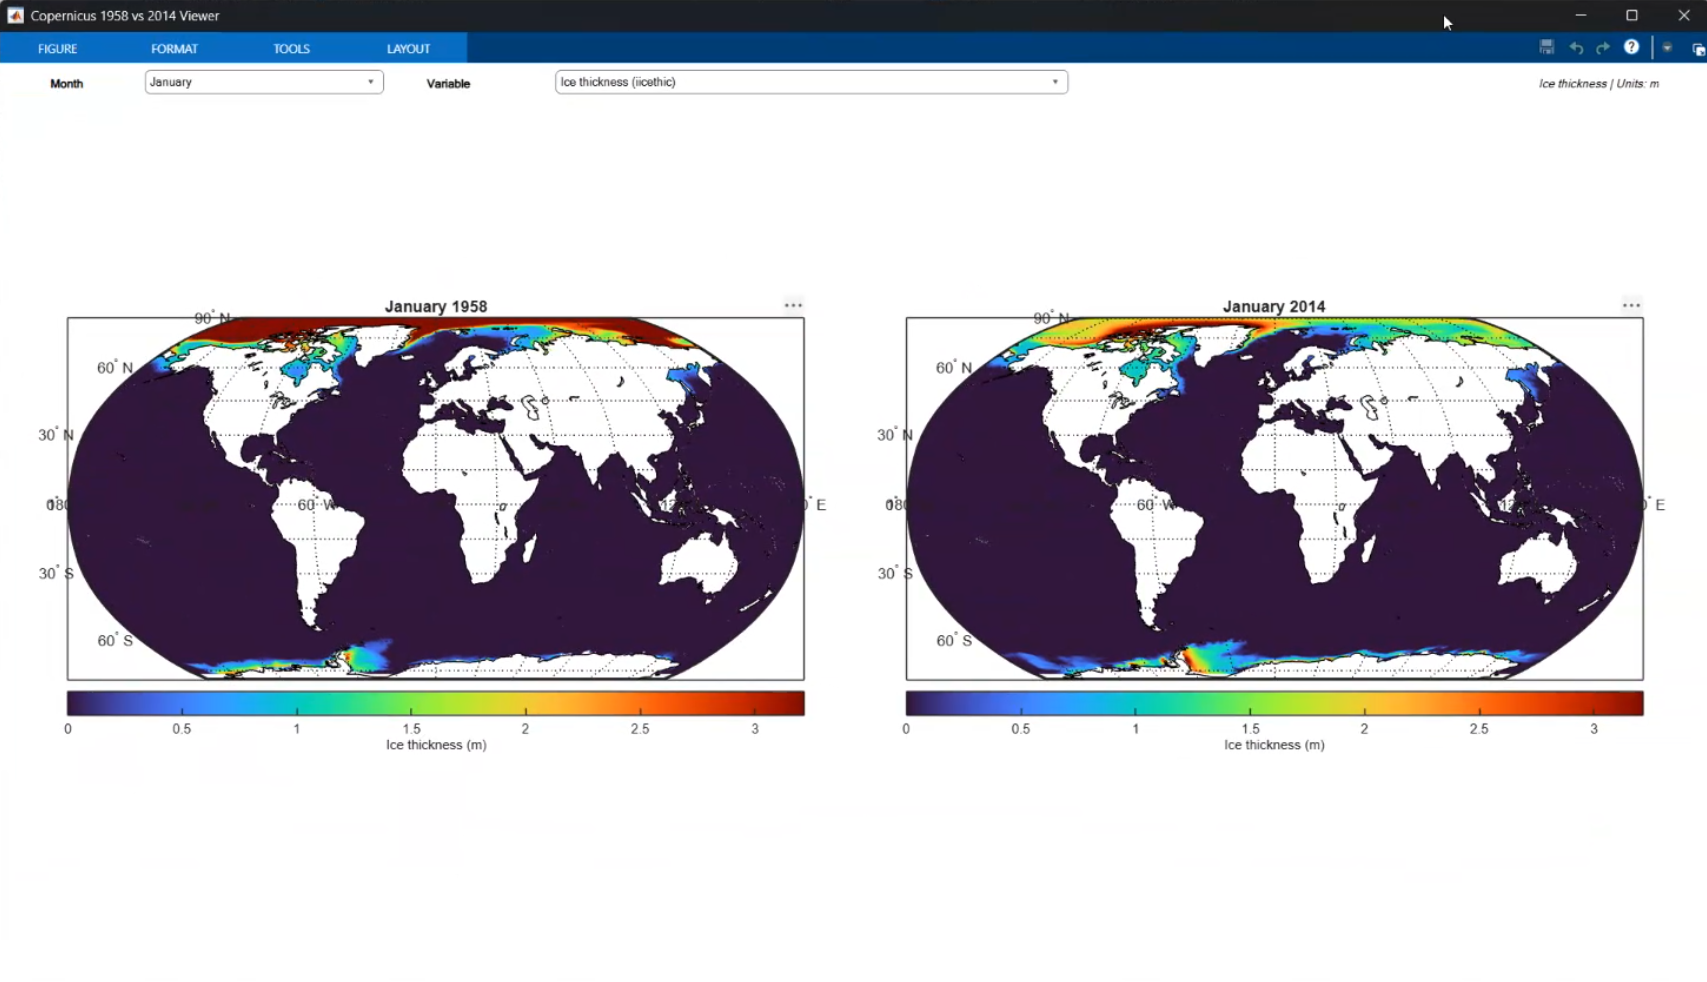
Adding suitable colormaps from a public repository
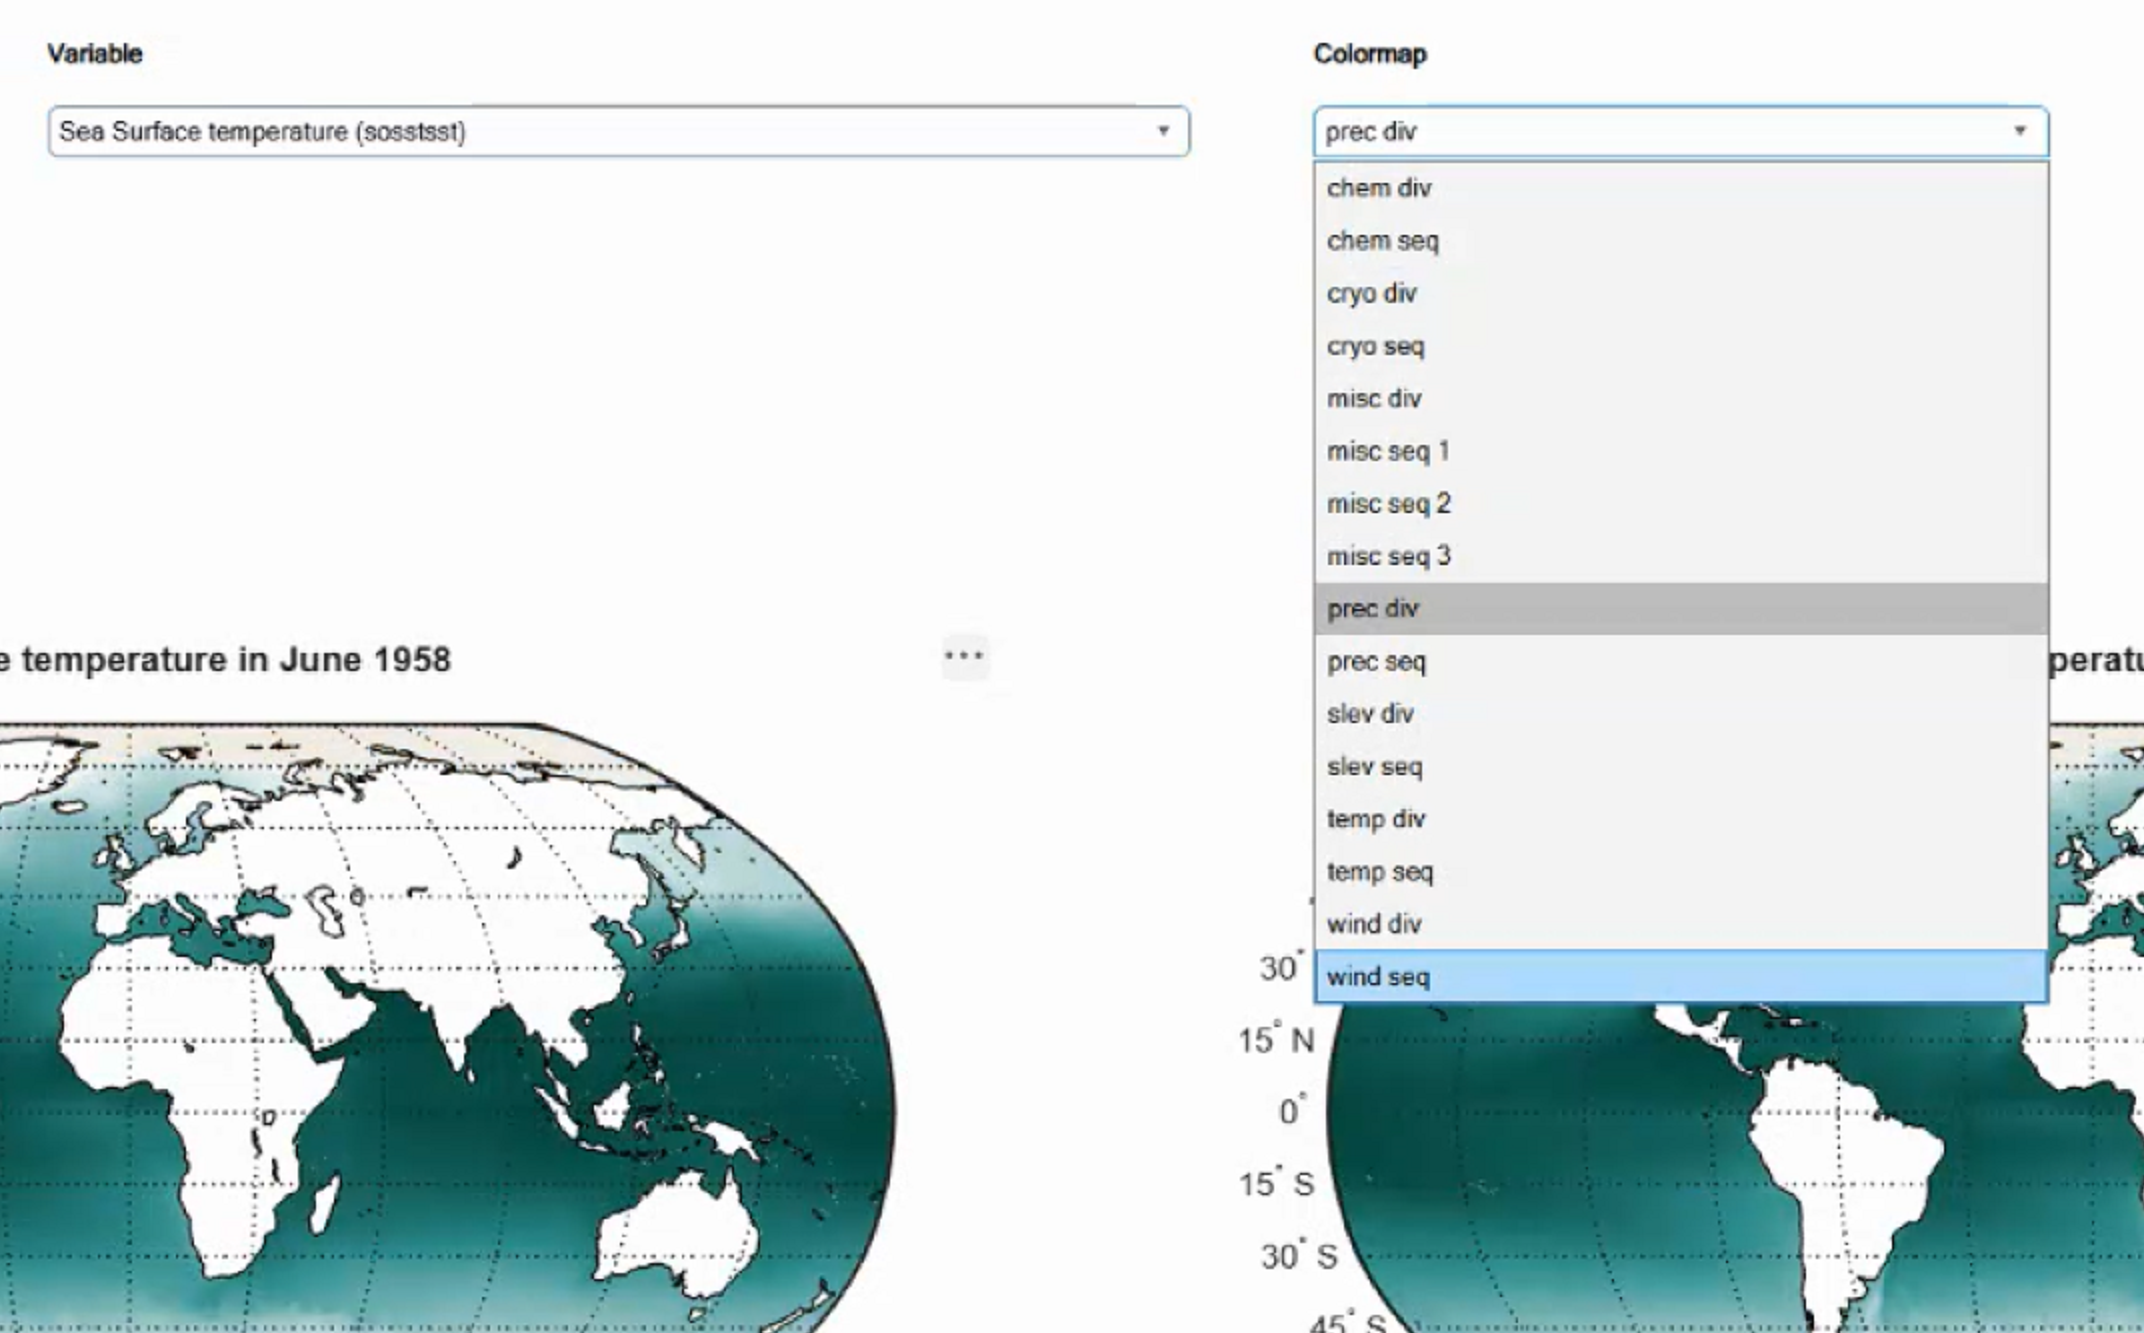
Once the basic workflow was working, I wanted more flexibility in how the data were displayed. I’ll use the Standard Climate Colormaps for MATLAB, so my next request was:
Prompt 2: “Can you now add the continuous colormaps from the https://github.com/mathworks/Standard-Climate-Colormaps-for-MATLAB into the live script, to be selected from a drop down menu as well.”
This is a nice example of how I tend to work with an Agent. I don’t necessarily try to describe the complete application at the beginning. I run something, look at the result and then decide what I want to add or modify. In this case, I wanted to reuse an existing MATLAB resource rather than develop my own colormaps.
Exporting the result
Finally, visualization is not necessarily the end of the workflow. I may want to take a subset of the data and use it somewhere else.
So my last prompt was very simple:
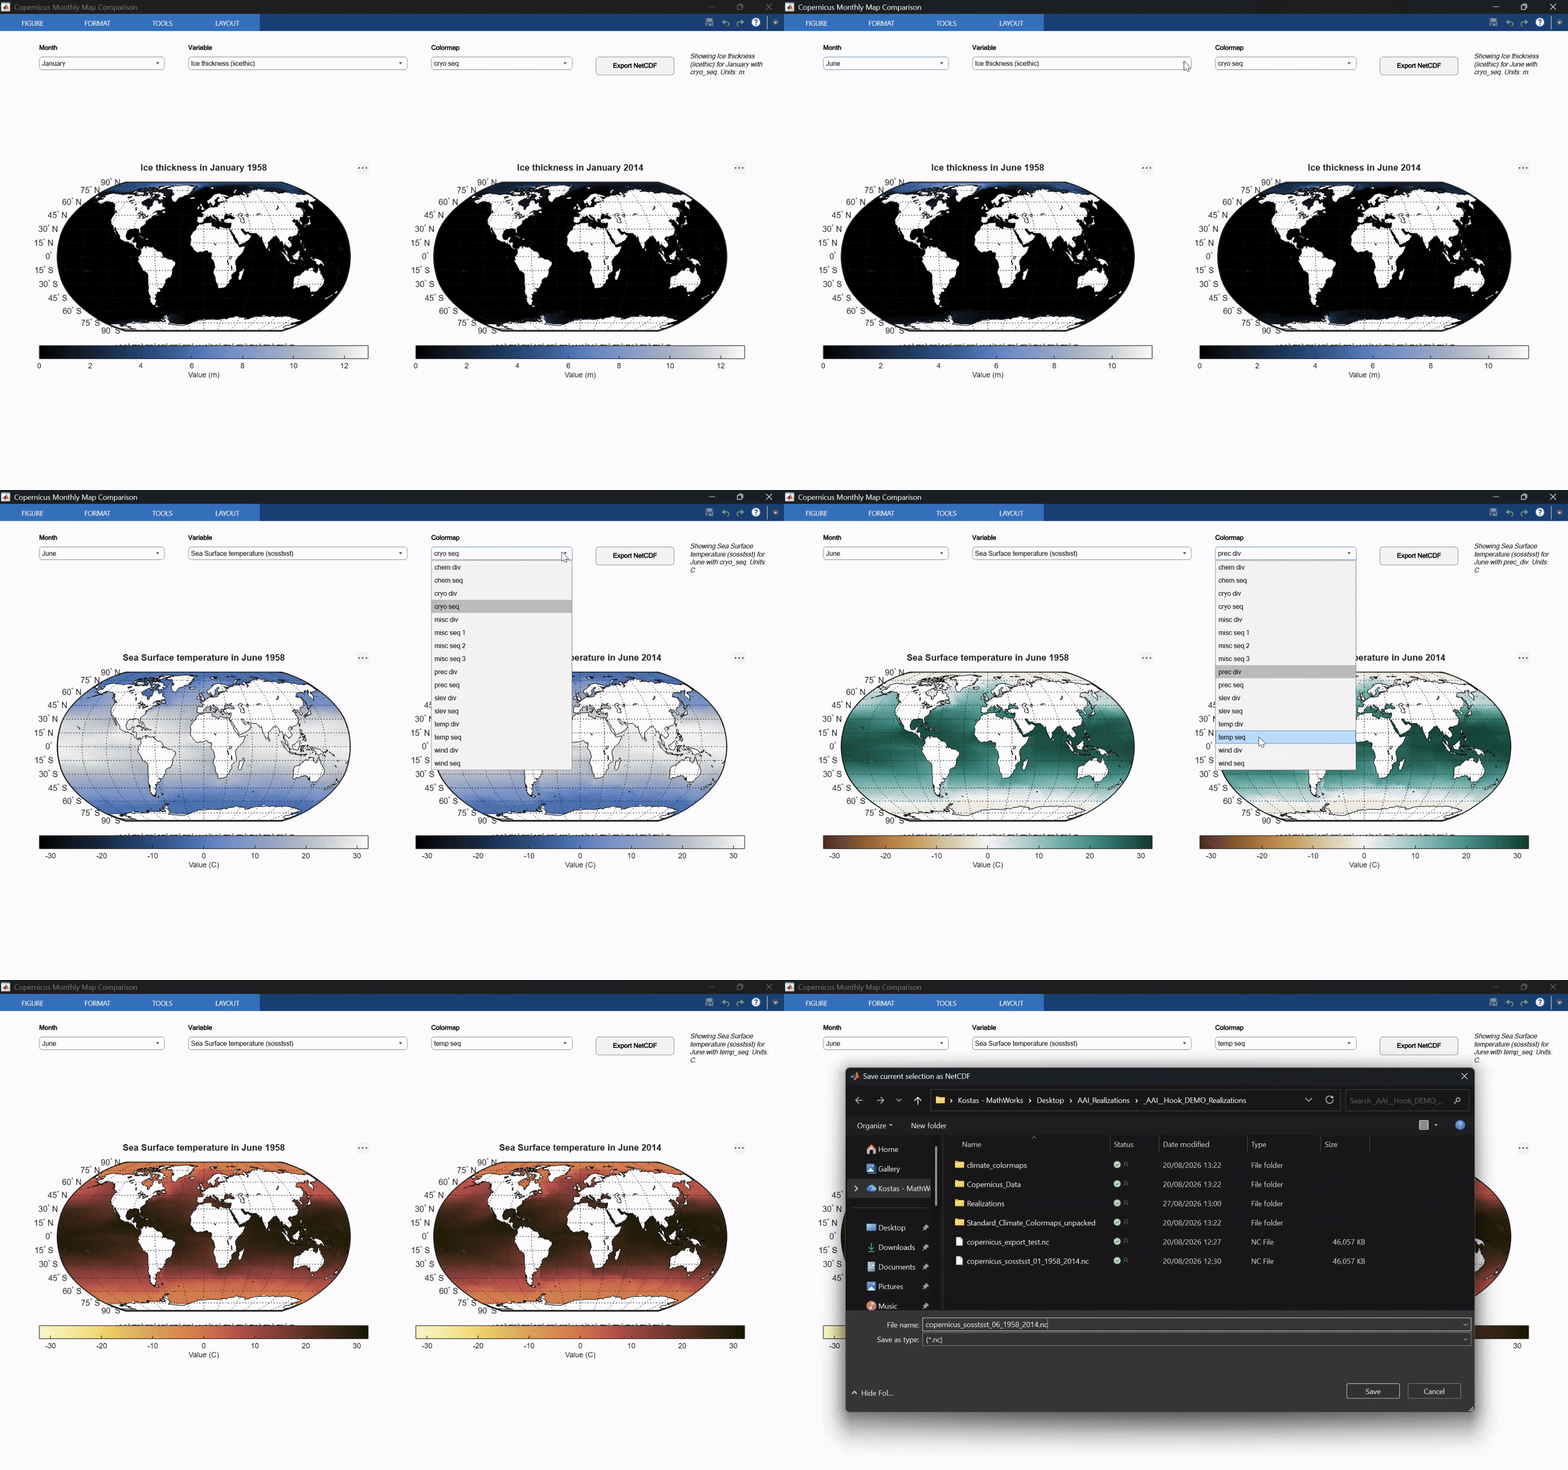
Prompt 3: “Extract the selected parameters to a netcdf file.”
This gives me a small but complete workflow: I can inspect the Copernicus data, interactively select what I am interested in, visualize it, and export the selected data.
Working code isn’t the same as a useful result
The prompts above can produce a working result even without init.md. But code that runs without errors isn’t necessarily the result I want.
For a geoscience workflow, I mostly care about how the data are represented:
- the projection
- appropriate colormaps
- readable figures
- whether the result would be suitable for scientific communication, teaching or publication.#
The markdown file is how I bring a (geo)scientist’s requirements into the task. My instructions go beyond “make the code work, make no mistakes”. In hindsight, I could have split init.md in two. The project rules (approach, execution, deliverable) could go in an AGENTS.md file, which my Agent reads automatically. The netCDF conventions could become a skill that I can reuse on other datasets, alongside the skills that ship with the MATLAB Agentic Toolkit.
The result isn’t a black box either. Behind the dropdown menus is a plain MATLAB script, written with the functions I chose. I reviewed it before trusting any of the plots, and I can rerun or modify it whenever I need to. When I need a programmatic, reproducible workflow for a publication, the code is already there.
That’s probably the main lesson from my experiment. I still decide what I want to do with the data and what a useful scientific result looks like. The coding Agent is another tool that helps me implement and iterate on those ideas, just faster.
So, back to you, dear reader. What workflows are you keen to automate? are there any tools that you can now create to make your science more accessible, reproducible or robust? Let us know in the comments!
To take this further:
- 类别:
- AI,
- Apps,
- Education,
- Science


评论
要发表评论,请点击 此处 登录到您的 MathWorks 帐户或创建一个新帐户。