
Responding to SR 26-2: From Strategic Interpretation to Practical Evidence | Part 4 of 4
When Monitoring Should Trigger Validation: A Practical SR 26-2 Case Study
How repeatable monitoring and validation evidence can support defensible model risk decisions.
 |
Expert Contributor: Michael Belfanti Michael is an Application Engineer at MathWorks focused on financial services. He works on credit risk analytics, model validation, and risk management workflows, drawing on prior experience in credit risk modeling and model governance at U.S. banks. He holds a PhD in Mathematics from The Ohio State University. |
Series introduction
The first, second, and third posts in this series argued that SR 26-2 shifts more responsibility toward defensible, risk-based judgment.
Banking organizations have greater flexibility to tailor model risk management to a model’s purpose, exposure, inherent risk, and materiality. Still, they must be able to explain and support the judgments they make.
This final post addresses a practical question: What quantitative evidence can support those judgments?
Using a retail-mortgage probability-of-default (PD) model, we demonstrate a MATLAB workflow that
- calculates monitoring and validation metrics consistently,
- compares the results with configured performance criteria, and
- produces a reviewable evidence package.
The workflow does not attempt to determine model materiality, approve model use, or replace independent validation and governance. The goal is to provide repeatable quantitative evidence to support those decisions.
The Workflow in Practice
Our implementation consists of the following key elements:
- A monitoring entry point that evaluates a model’s performance on monitoring data. This is typically a “champion” model evaluated on recent monitoring data outside the model’s training sample.
- The monitoring covers discrimination, calibration, and stability metrics. The underlying functionality is provided by the risk.validation package in Risk Management Toolbox.
- The monitoring results are compared against explicit escalation criteria.
- If escalation is required, the validator can run the validation entry point. The validation workflow compares the “champion” model and a “challenger” model using configured training and testing datasets.
- The outputs of both the monitoring and validation runs are standardized reports containing raw metric values, threshold comparisons, and visualizations.
The workflow automates evidence production, threshold comparison, and escalation flags. The flags identify results that warrant review; the final governance decision is not automated. Analysts, SMEs, and model risk stakeholders still need to interpret the results in light of materiality, purpose, exposure, and policy. Users and SMEs can inspect and challenge the thresholds and controls. Any changes would remain subject to the institution’s established governance and change-control processes.
Case Study
Background and Goals
Our case study examines a representative case: a probability of default (PD) model for a portfolio of retail mortgages. The dataset is simulated and is included in Risk Management Toolbox. It includes both loan-level predictors and macroeconomic variables. The champion model is a binary logistic regression model trained on data from 2000 to 2018. The model was trained using fitLifetimePDModel from Risk Management Toolbox.
The calibration, discrimination, and stability metrics selected for this study can sit within the broader model risk framework. The main goal is to show that we can create repeatable and interpretable evidence to defend and justify escalation decisions. In particular, our simulated data does not include balance histories, so we are focused on performance criteria rather than quantitative materiality assessments. Qualitative aspects such as purpose, inherent risk, policy, and context are not addressed. As such, the workflow is not meant to be a comprehensive solution.
The Champion Model
The trained model contains two loan-level predictors, a binned age variable and a binned credit score, and one macroeconomic predictor, the current unemployment rate. The bins were selected using the binningExplorer app. The age and credit score predictors were retained because their binning patterns show stable, interpretable separation between lower- and higher-risk segments. The unemployment series tells the complementary macro story: default behavior rises and falls with broader economic stress, which is exactly the kind of external condition a PD model should react to in a transparent way.
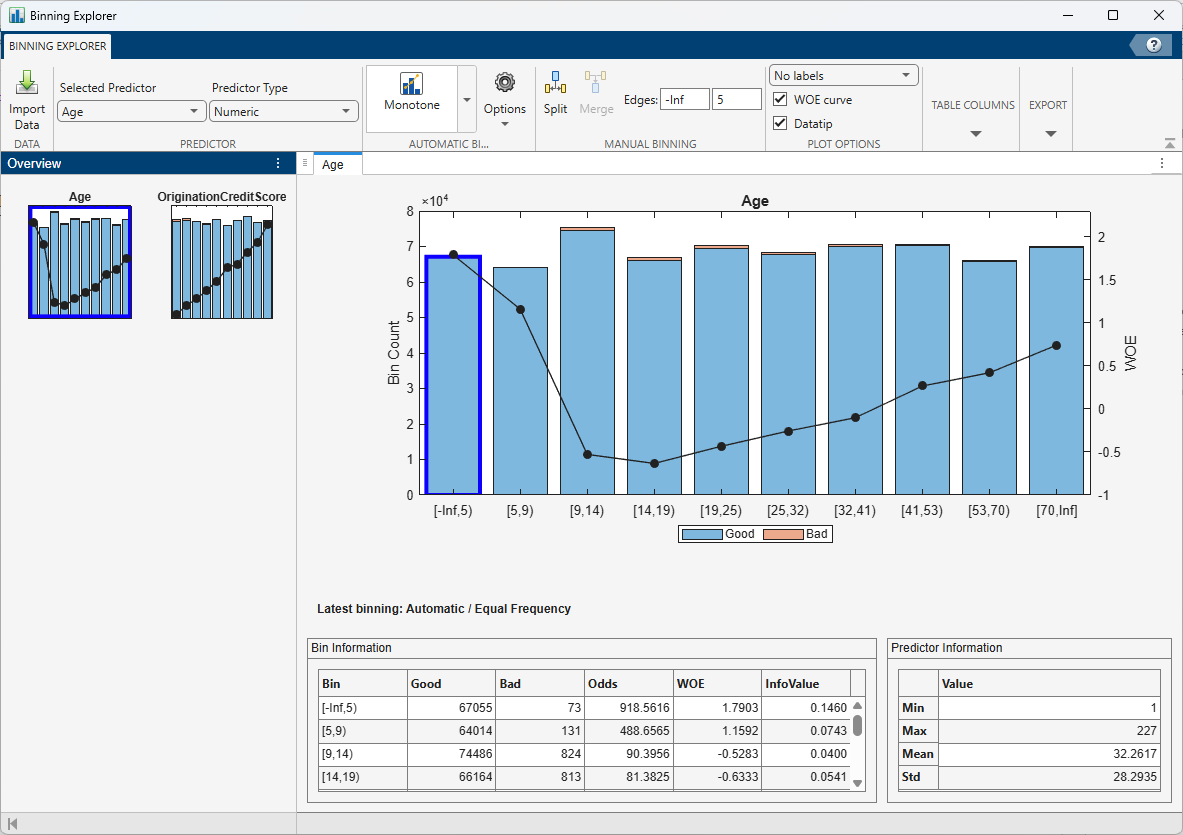
Age binning shows a nonlinear relationship with default risk, supporting discretization rather than a raw linear term. |
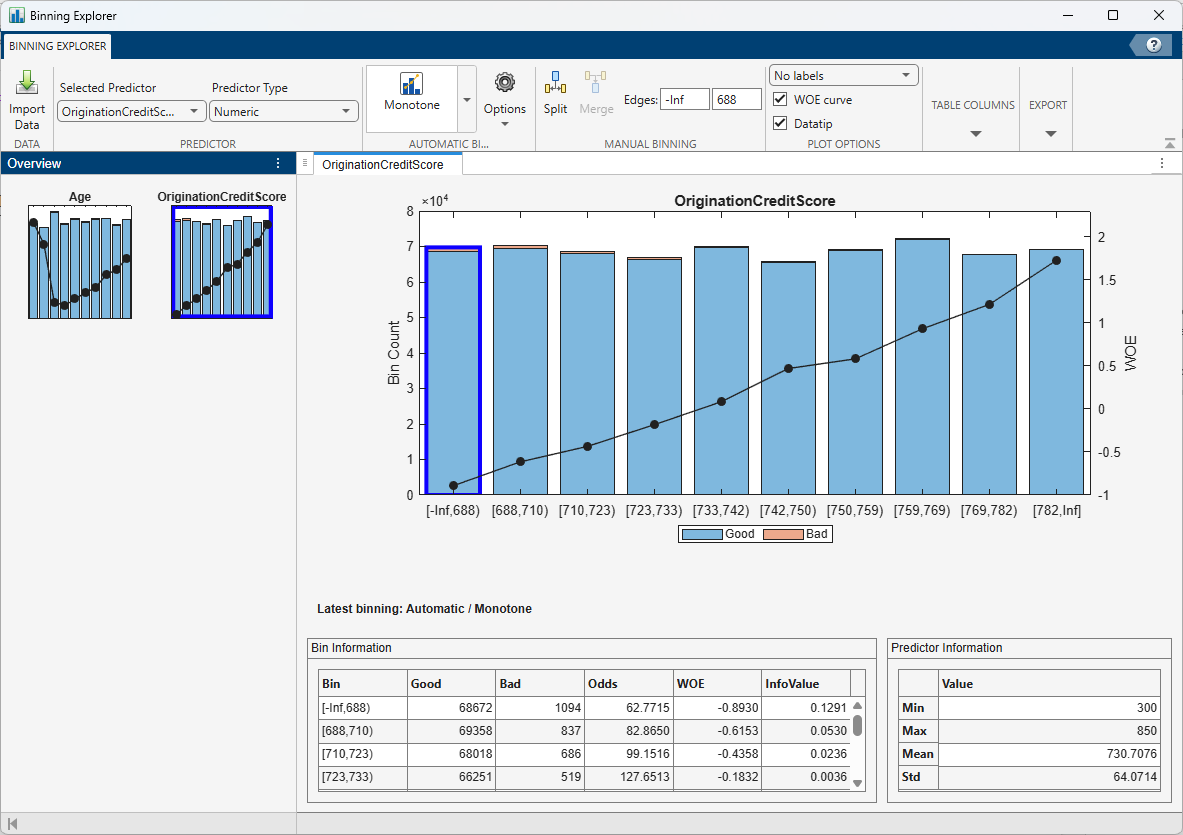
Origination credit score exhibits a clean monotonic relationship with default risk, making it a strong discriminator. |
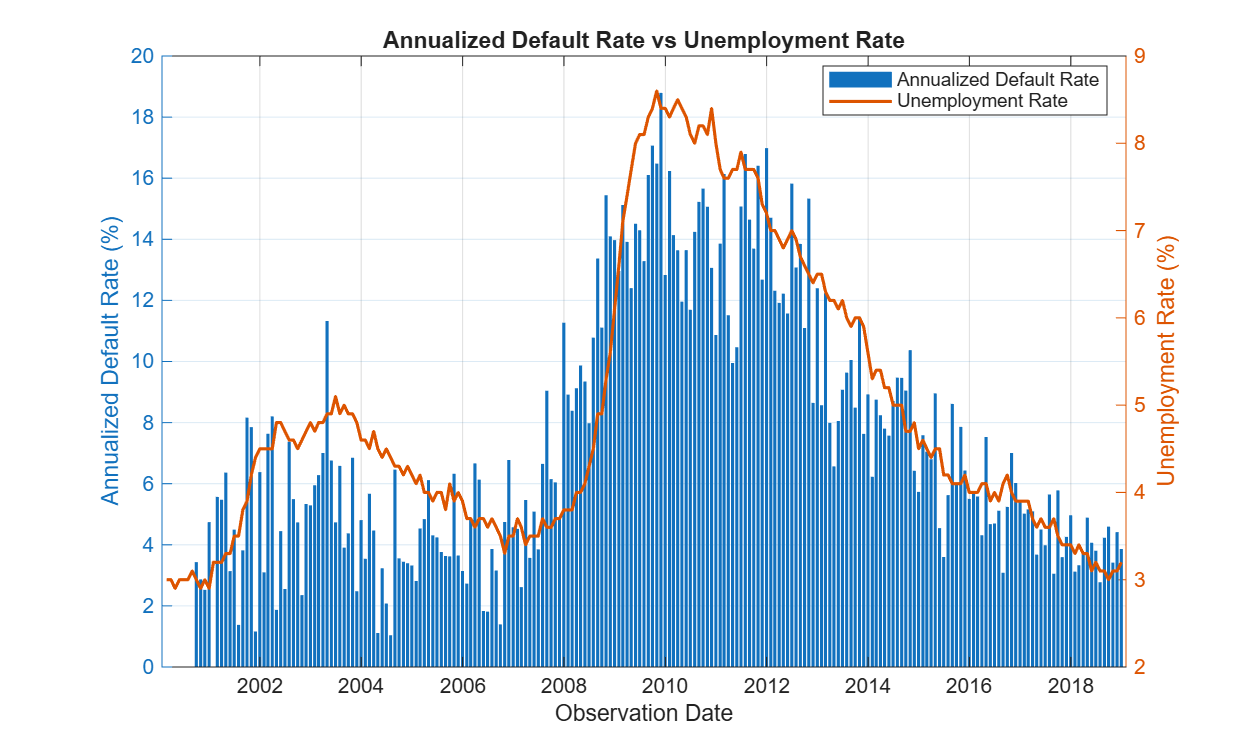
Observed default rates track the unemployment cycle closely enough to justify including a contemporaneous macroeconomic driver.
The selected variables define a model that, while simple, tracks the actual default rate throughout the historical training period. In particular, the inclusion of the unemployment rate as a macroeconomic variable drives an increase in PD during the financial crisis.
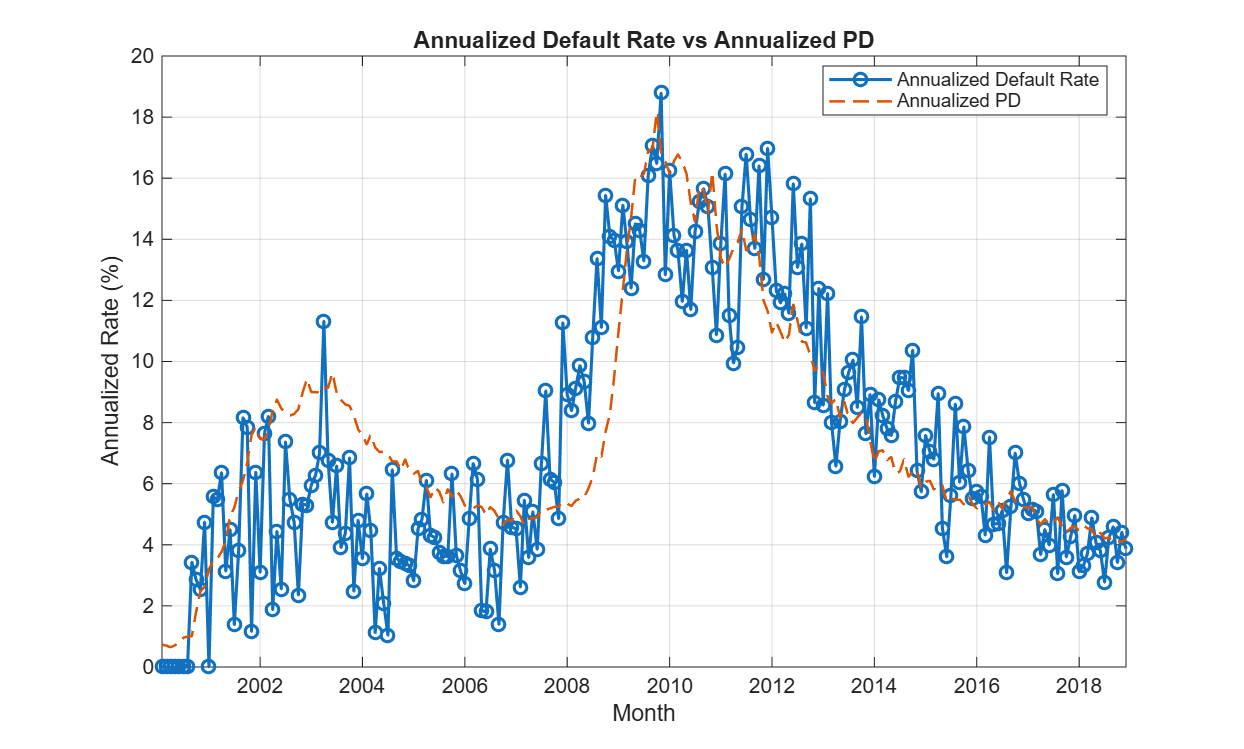
On the training sample, mean predicted PD and the observed monthly default rate move together in a way that is directionally consistent with the model design.
Ongoing Monitoring
The model is trained on data that includes December 2018. Assume that the model goes into production immediately, so that it is eligible for ongoing monitoring beginning in January 2019. We run the monitoring report for the period January 2019 to April 2019. The report highlights both “warnings” and “breaches.” A warning indicates a mild degradation in observed performance, while a breach is more severe. The rules can be configured by the validator. They are applied consistently and are reviewable and challengeable.
Note that, while the Hosmer-Lemeshow test for calibration failed in April, the single-month breach constitutes a warning status rather than a breach status at the summary level:
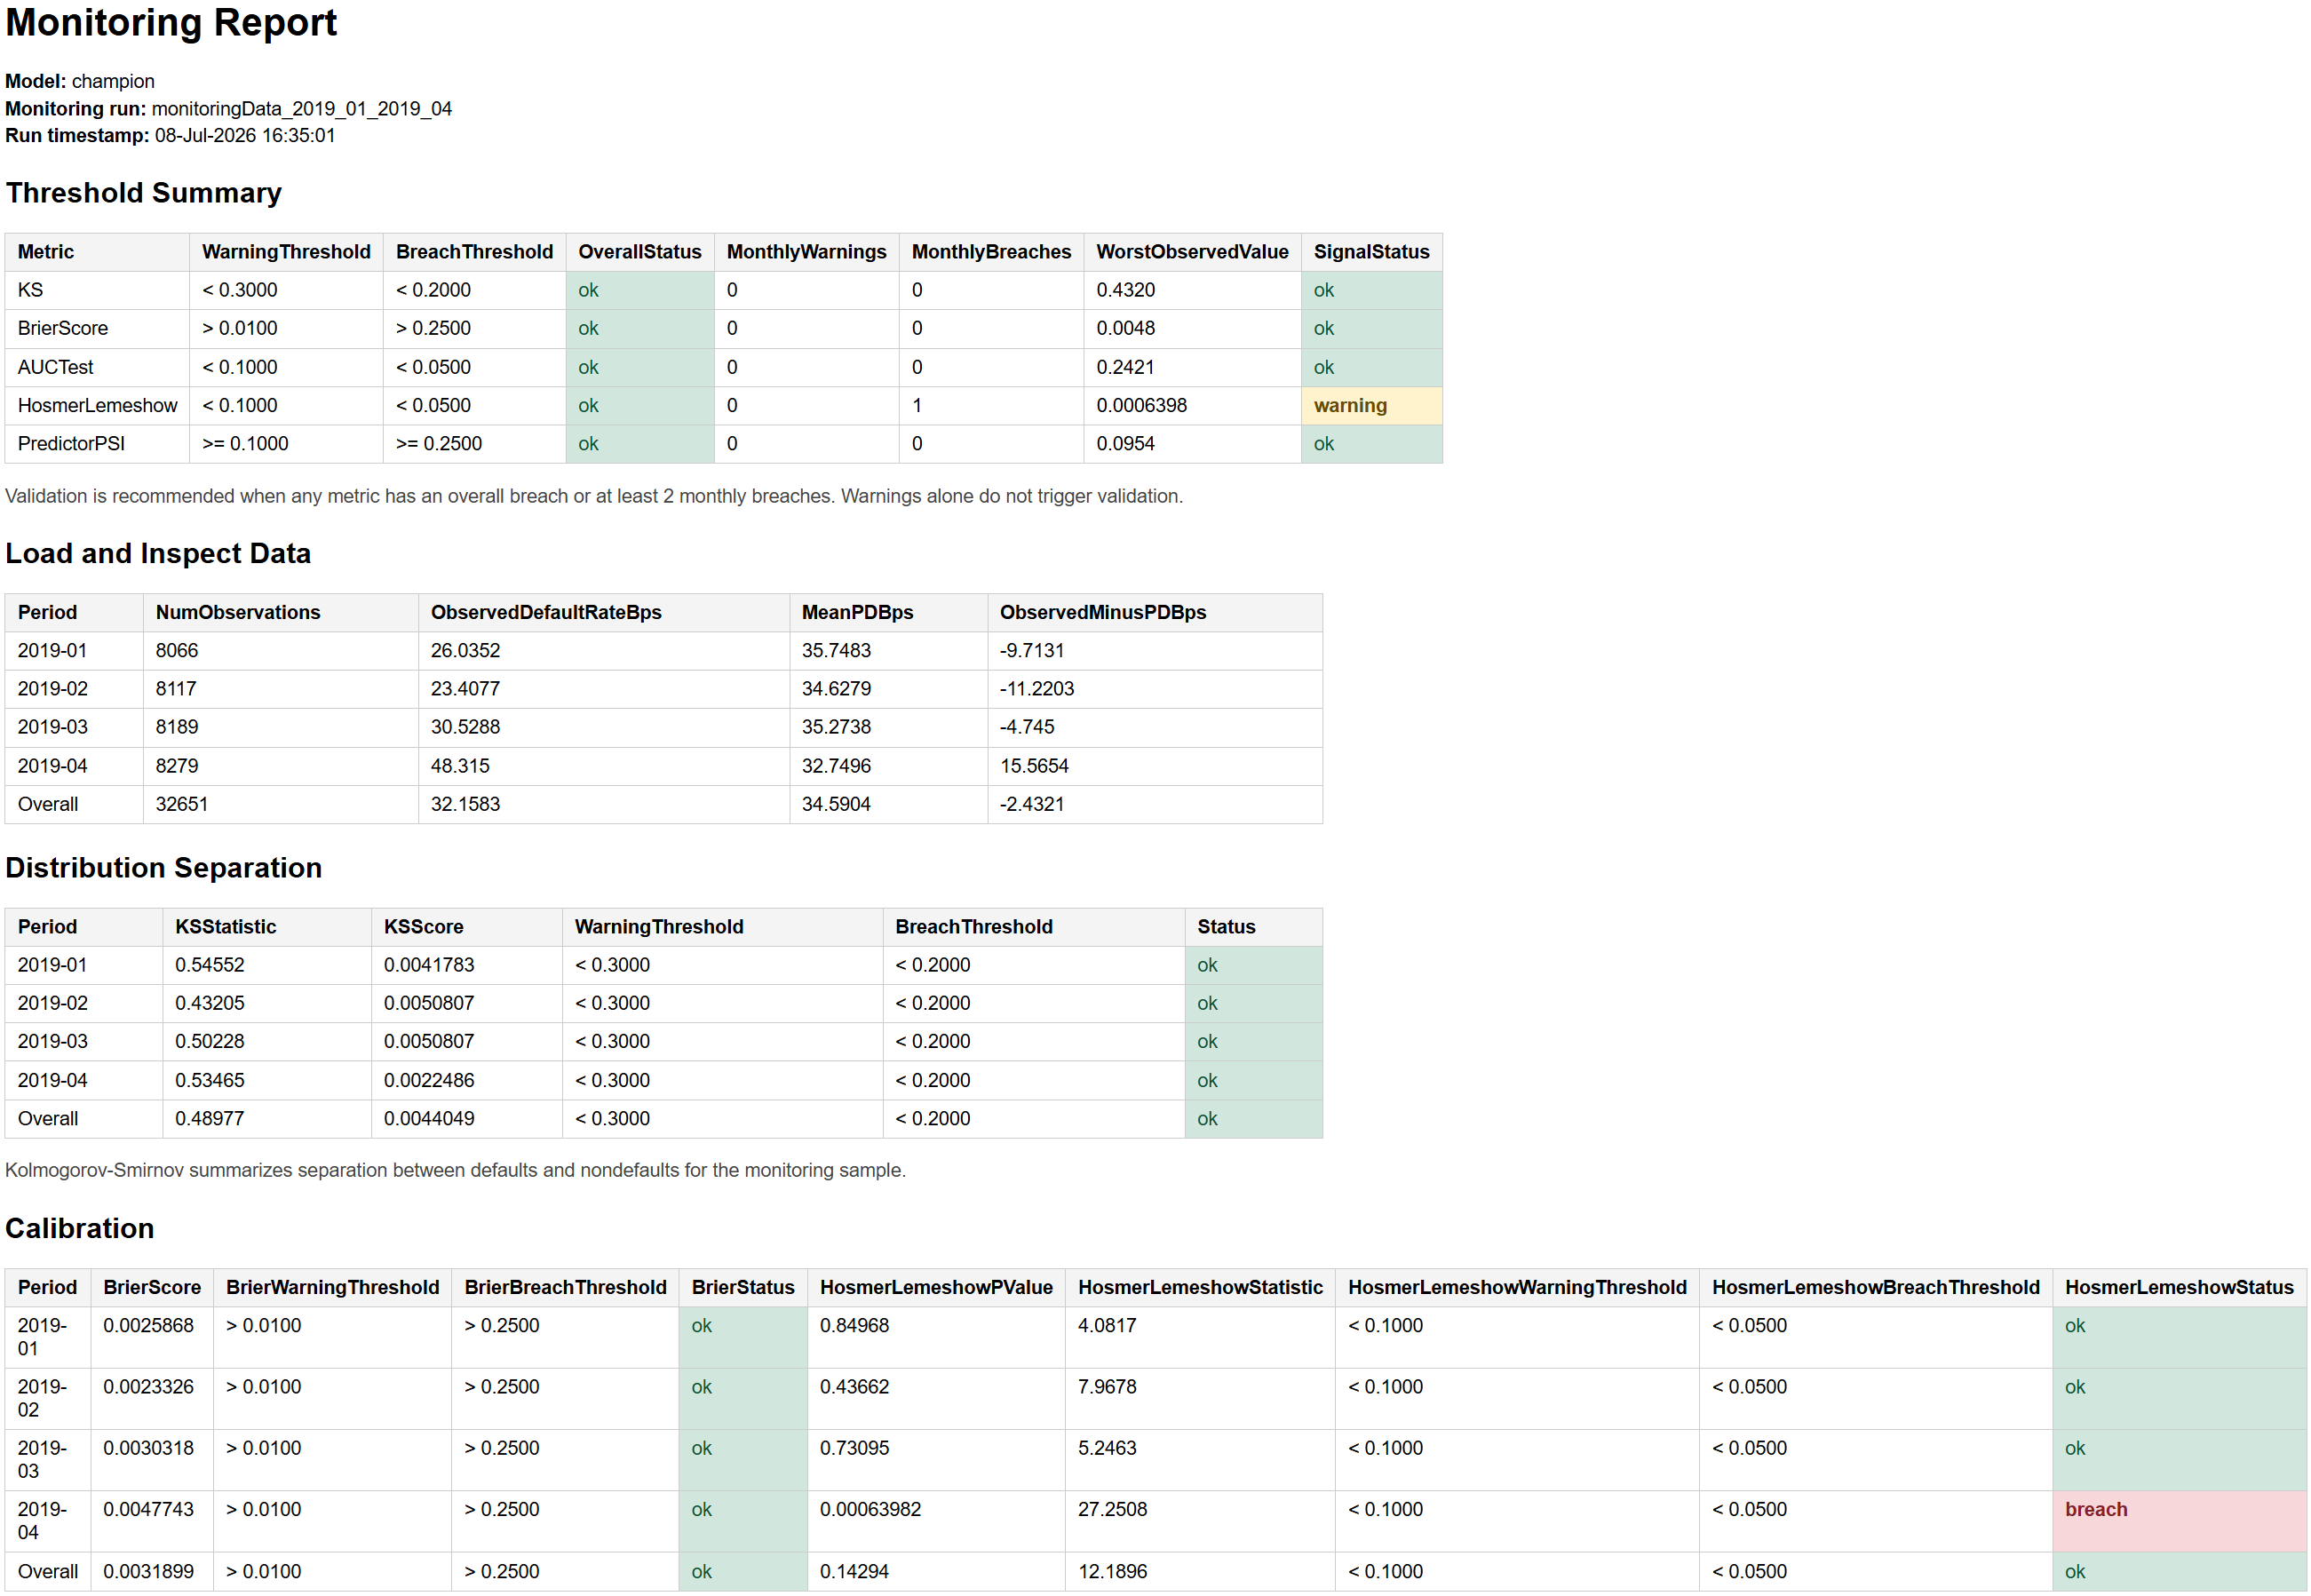
The January to April 2019 monitoring window shows one calibration warning in April, but no repeated breach pattern requiring escalation.
The monitoring run is designed to compute both monthly and overall statistics for the monitoring data. By the end of the year, there is a breach at the overall level for the Hosmer-Lemeshow test:
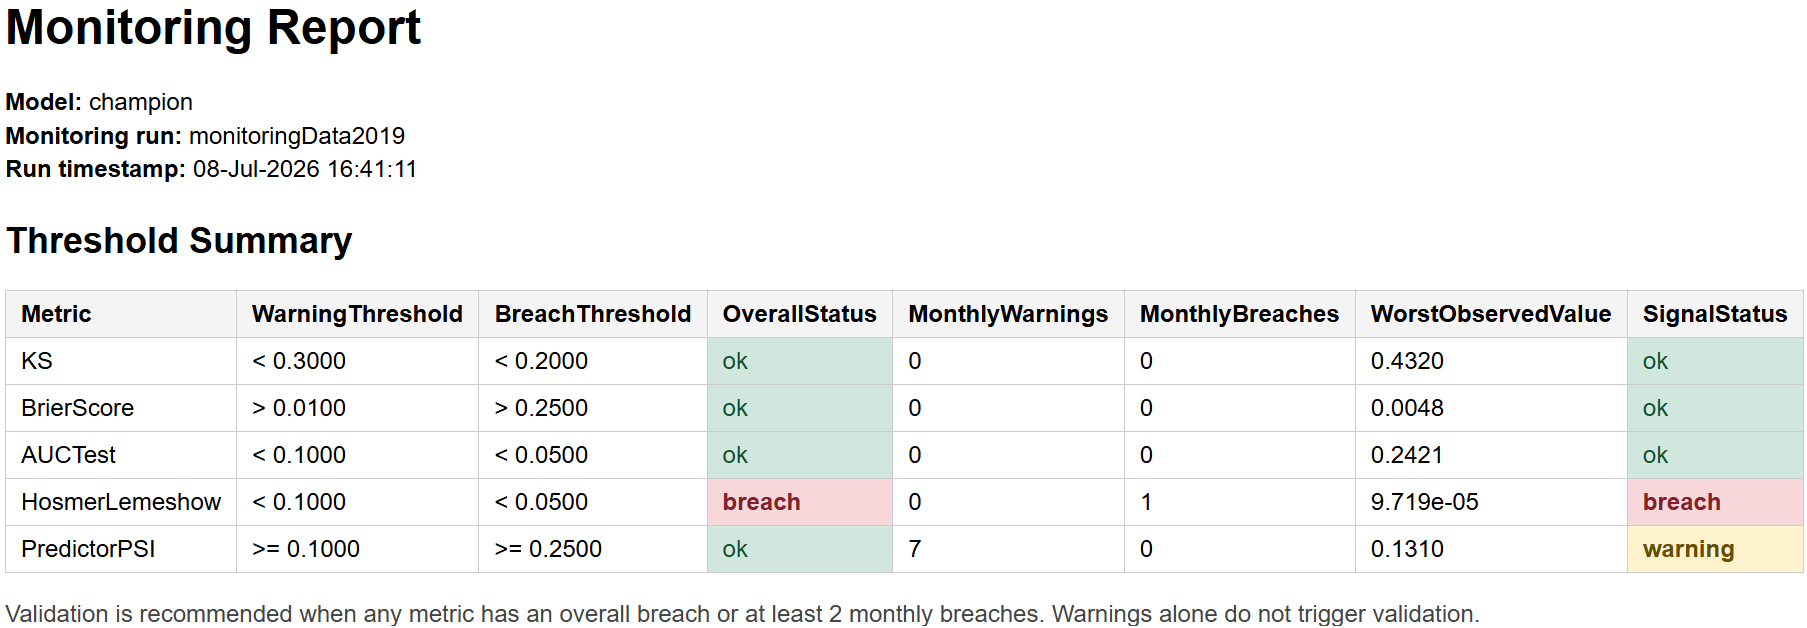
Extending the monitoring window through year-end produces an overall calibration breach.
The configured monitoring rule flags any overall-level breach for escalation review. However, the breach does not by itself determine that a full validation or model change is required. There have been no additional monthly breaches in either calibration metric, and predicted PD is generally above the observed default rate during the monitored period. The result is therefore evidence to investigate, not an automatic model decision. Experts must interpret it in the context of the model’s materiality, intended use, and the bank’s documented model risk policies.
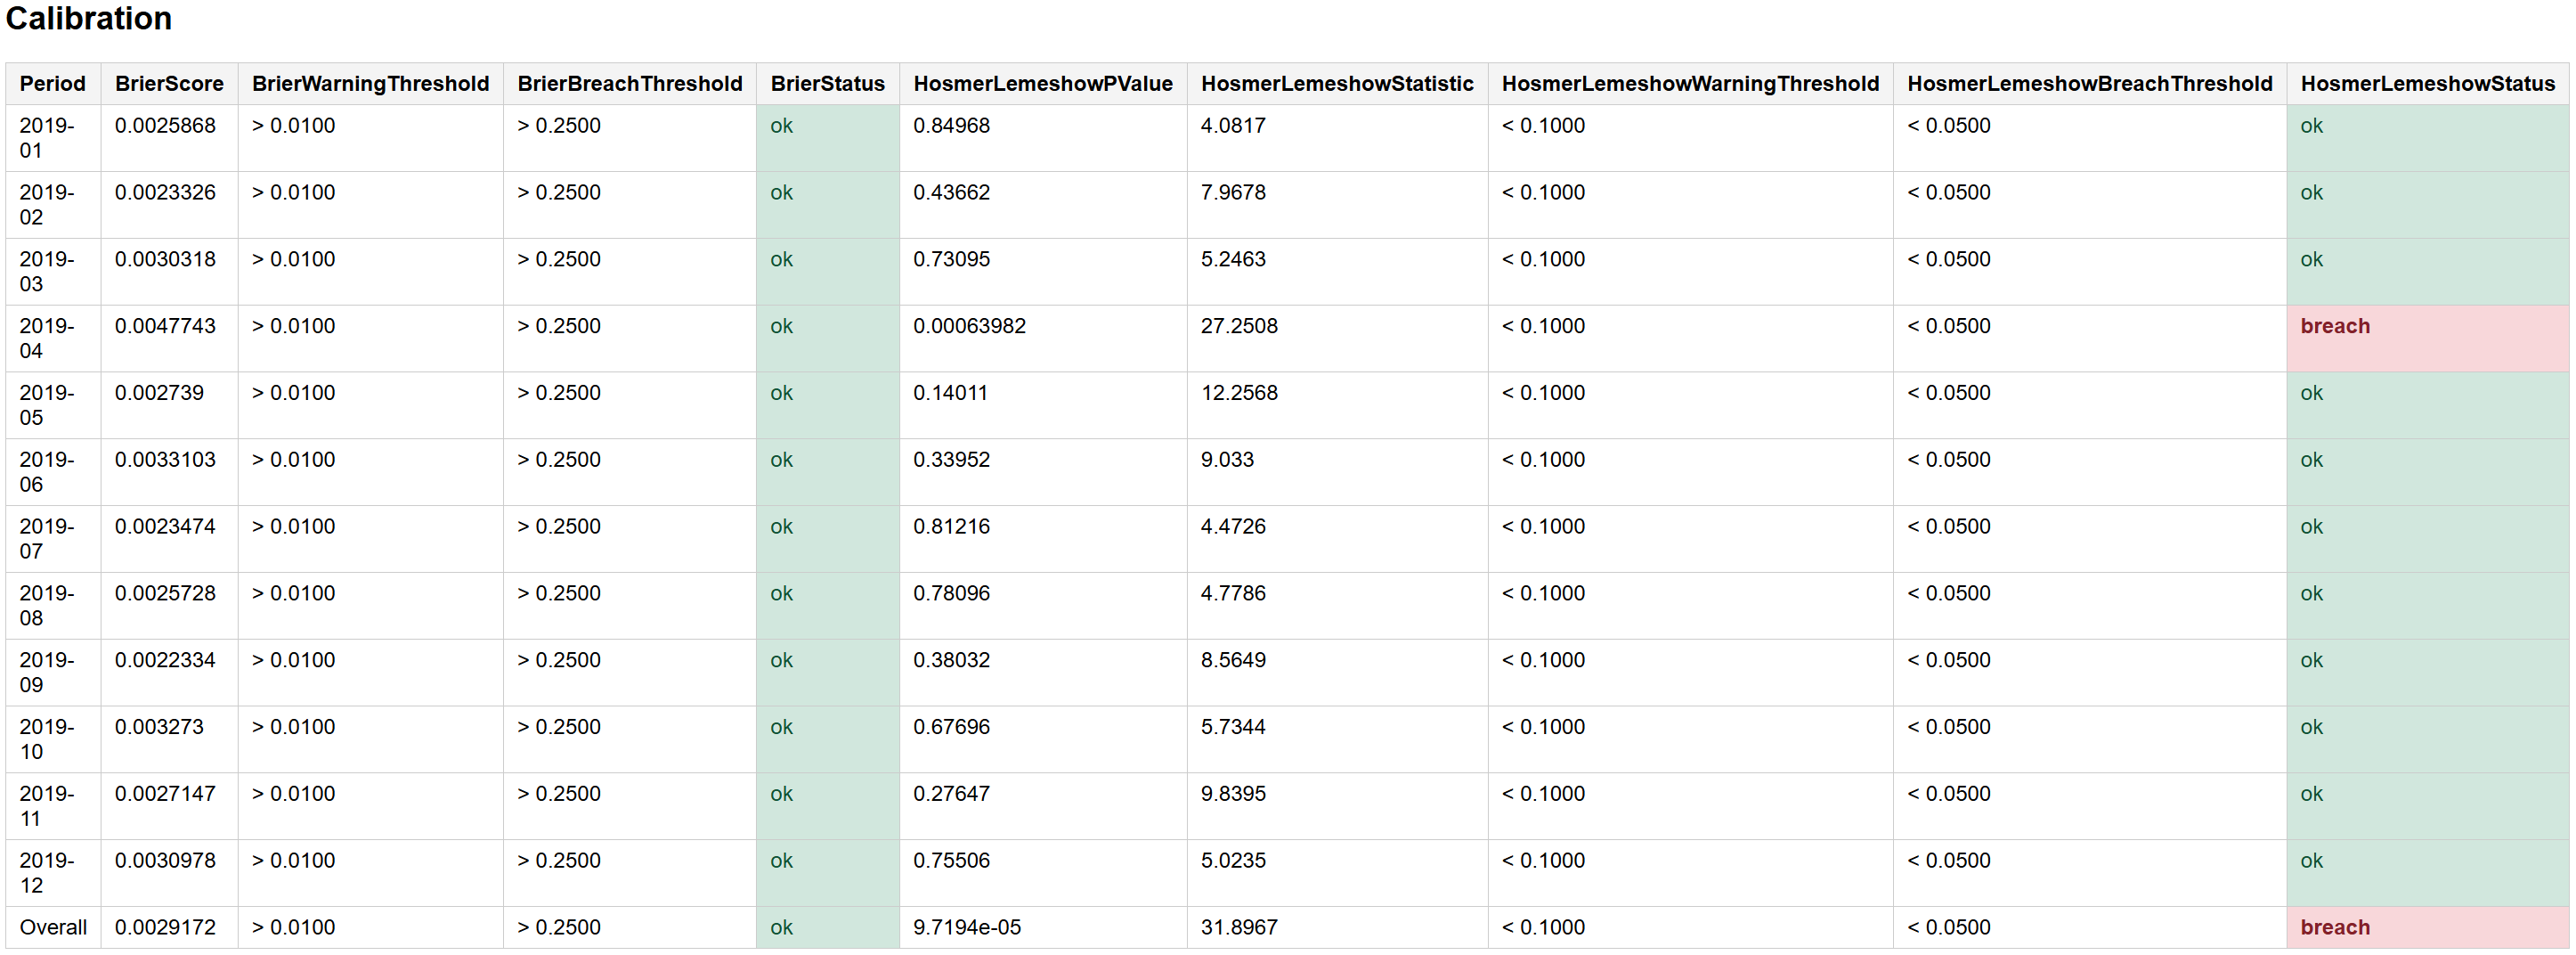
The calibration view shows that the year-end concern is concentrated in a limited part of the monitoring horizon rather than in a uniform deterioration every month.
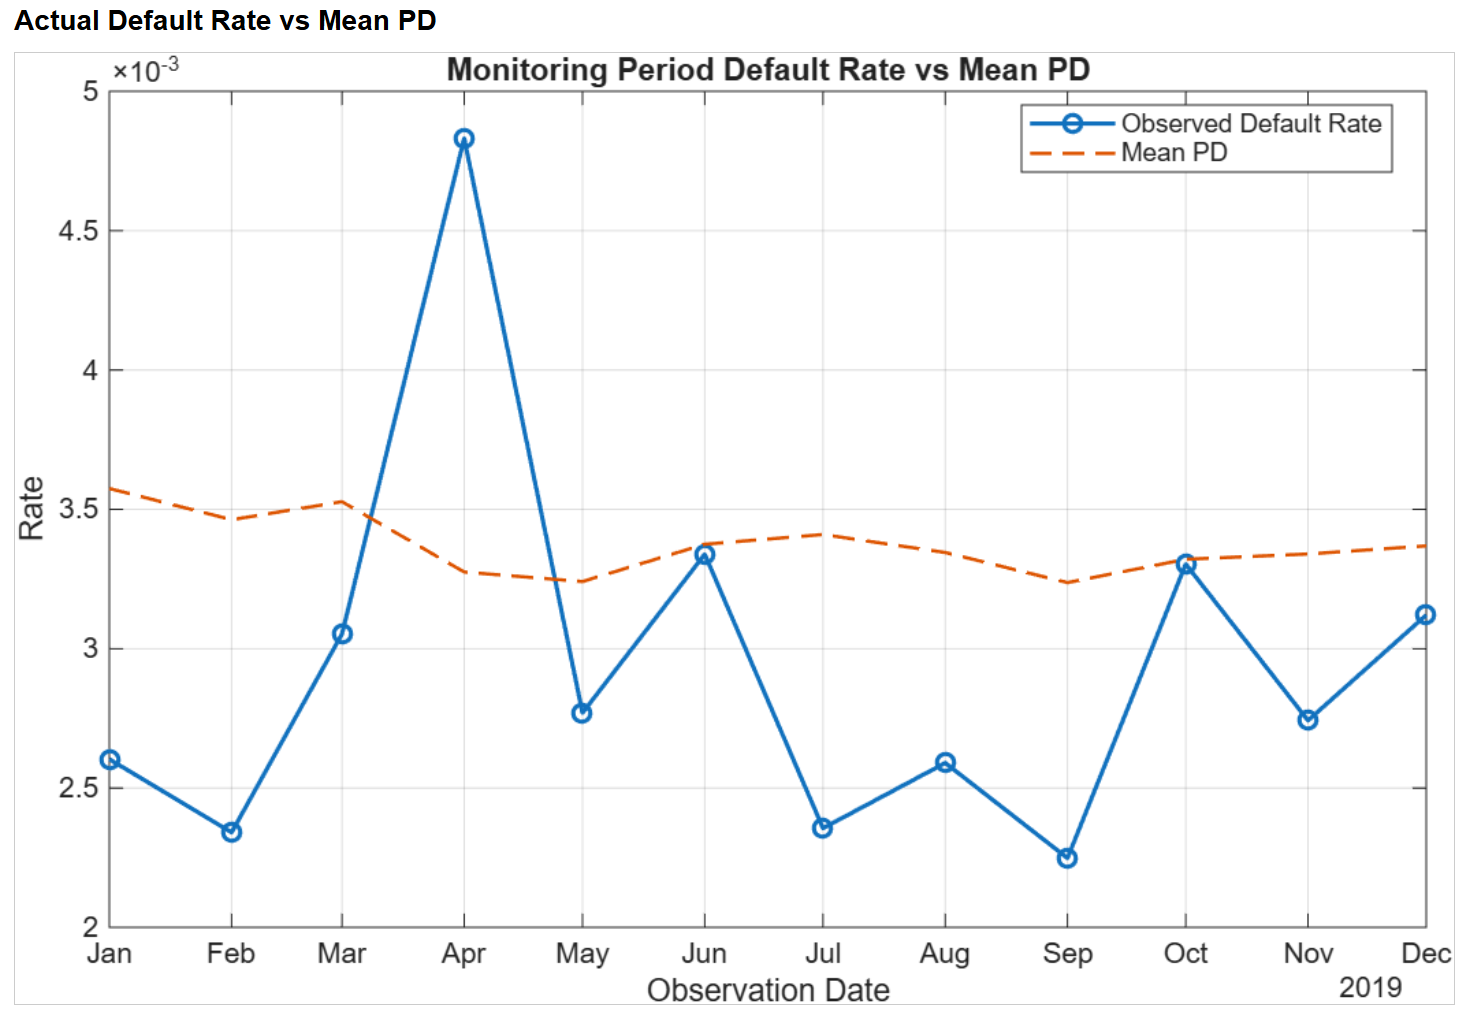
Actual and predicted default rates remain directionally aligned, which helps explain why escalation still requires analyst judgment rather than a purely mechanical conclusion.
Escalating to Validation
Fast forward to May 2020. The model has been in production for over a year. A standard ongoing monitoring run covers the previous 12 months of data:
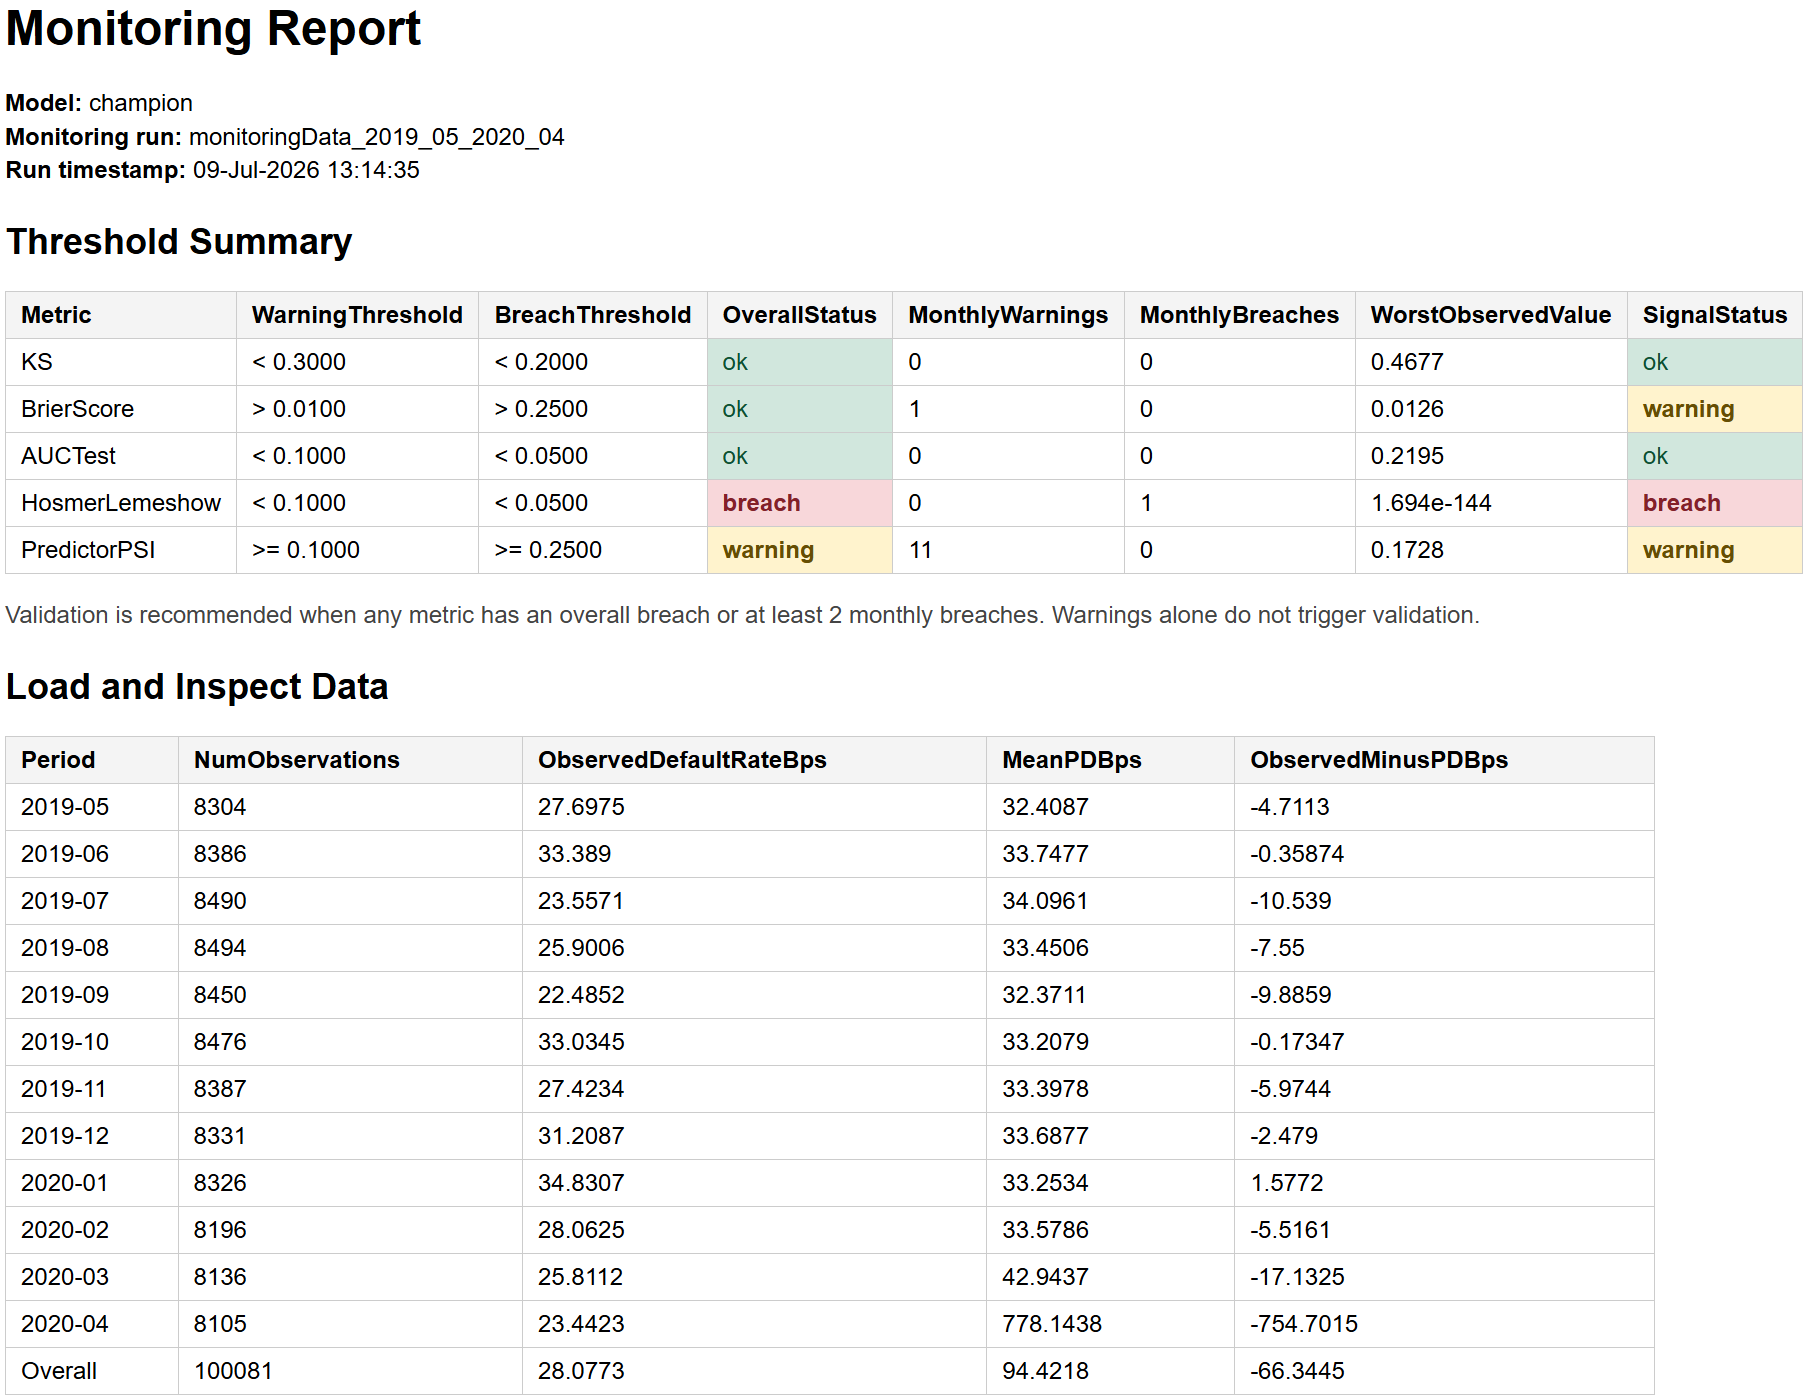
By May 2020, the rolling 12-month monitoring window shows a materially different performance profile, creating a clearer basis for escalation to validation.
The metrics have deteriorated since 2019. While the Hosmer-Lemeshow test had breaches earlier, it is now accompanied by a warning in the Brier score. The PSI indicates a moderate shift in almost every observed month and at the overall level. Moreover, it is clear what has happened. The April 2020 PD is a substantial overestimate relative to the observed default rate; this particular estimate is large enough that the overall PD is now three to four times higher than the observed default rate.
The unemployment variable appears to be a primary driver of the April 2020 overprediction. The relationship between unemployment and mortgage defaults estimated from the historical data does not hold in April 2020 to the degree implied by the model. This identifies a plausible model limitation, although it does not establish that unemployment is inherently an inappropriate indicator.
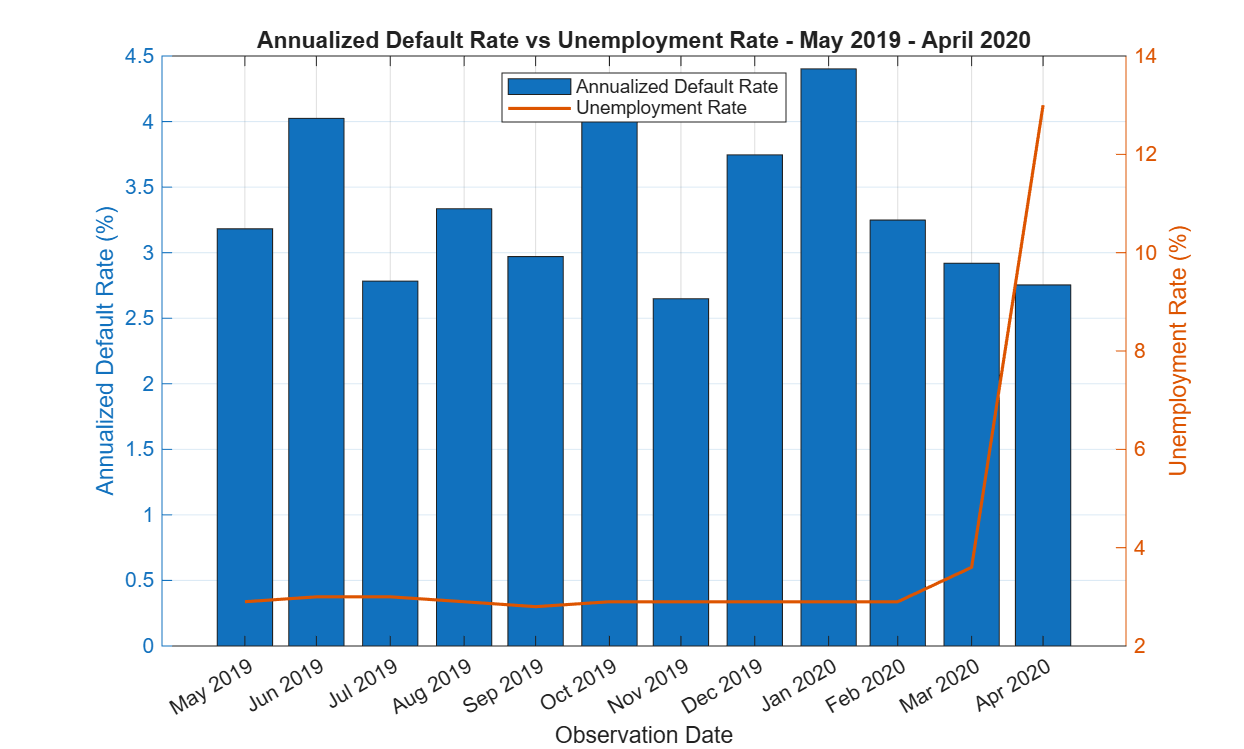
The April 2020 unemployment spike breaks the earlier relationship between macro stress and observed defaults, which helps explain the model’s overprediction and the stronger case for escalation.
Unlike the isolated 2019 exception, the 2020 case presents converging evidence: a large prediction error, deterioration across multiple measures, broad population shifts, and a plausible link to the model specification. The evidence supports an escalation from monitoring to validation.
Validation
Our analysis suggests that the inclusion of the unemployment rate macro variable explains the unusually poor performance in April 2020. To test this, we trained a challenger model, using additional data collected since the champion went into production, that maintains the same loan-level predictors but replaces the unemployment rate with the housing price index:
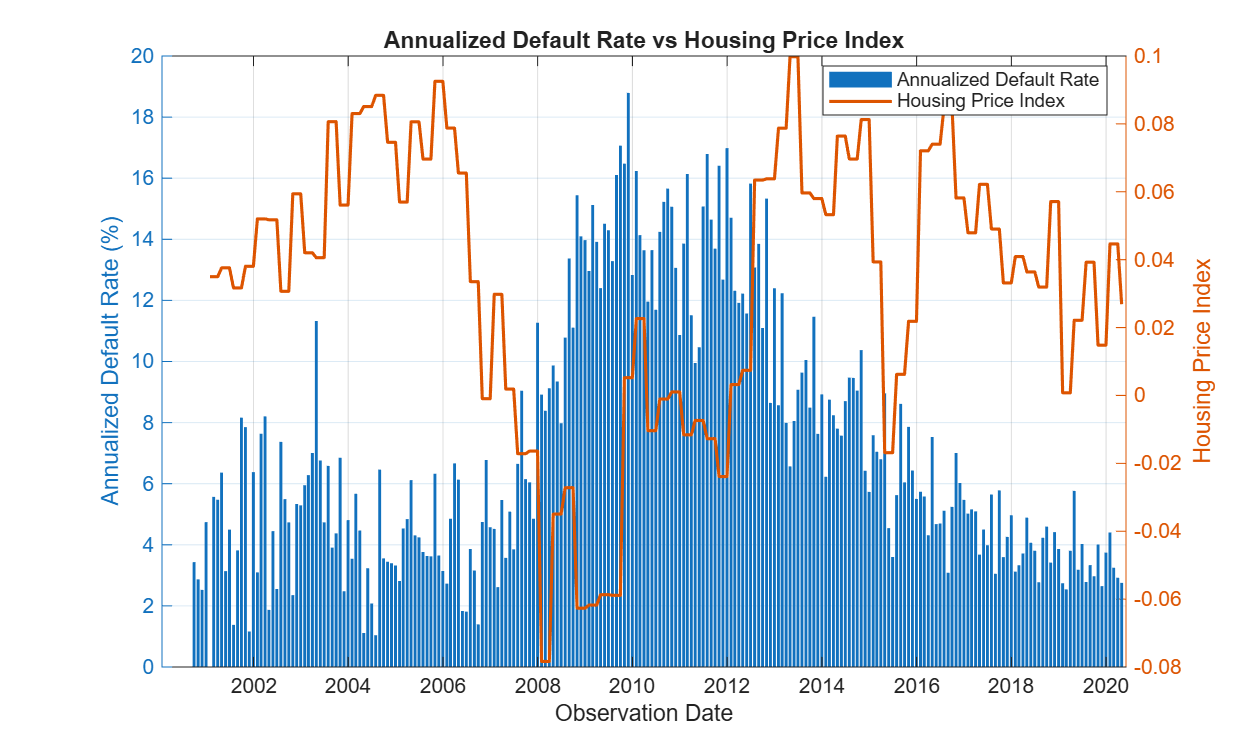
The challenger replaces unemployment with a relative change in HPI rather than a level measure, since housing prices are expected to increase over time.
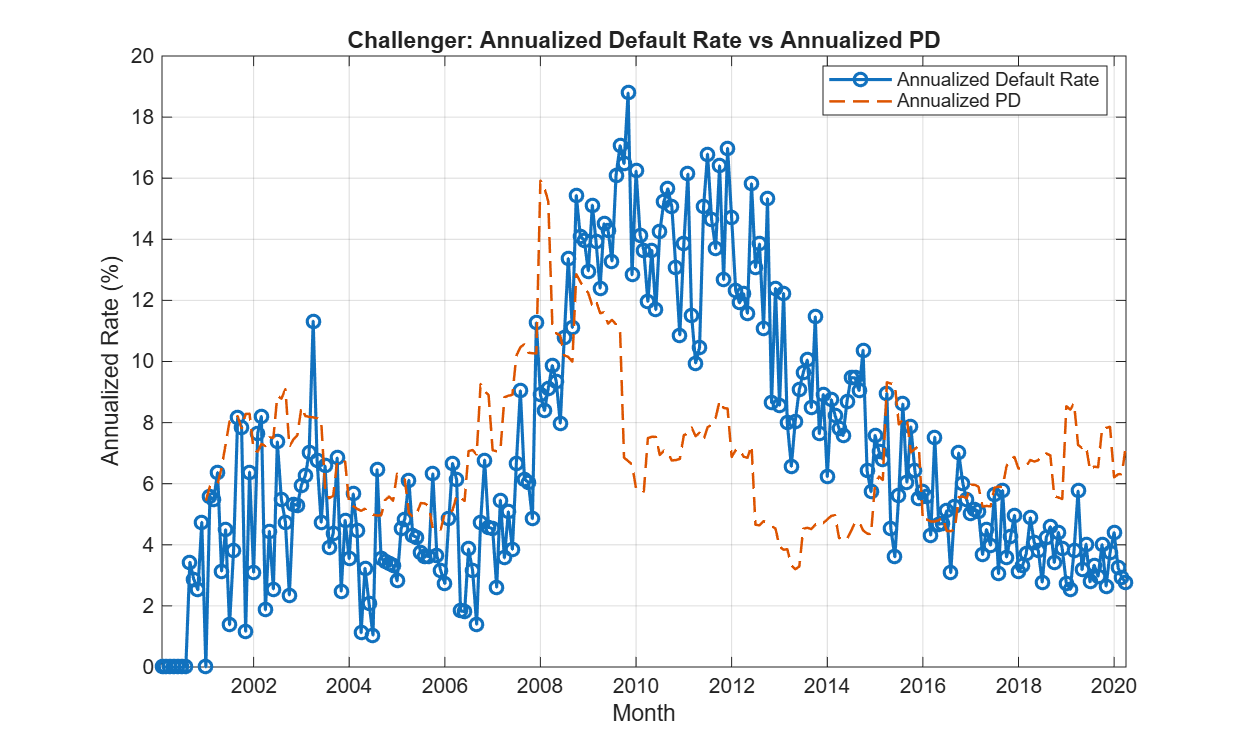
On the challenger training sample, mean predicted PD and the observed monthly default rate remain directionally aligned without relying on unemployment as the macro driver.
The challenger does not appear to track the observed default rate as closely as the champion; there is underestimation during the financial crisis and overestimation since 2018. The validation report provides statistics that confirm our assessment:
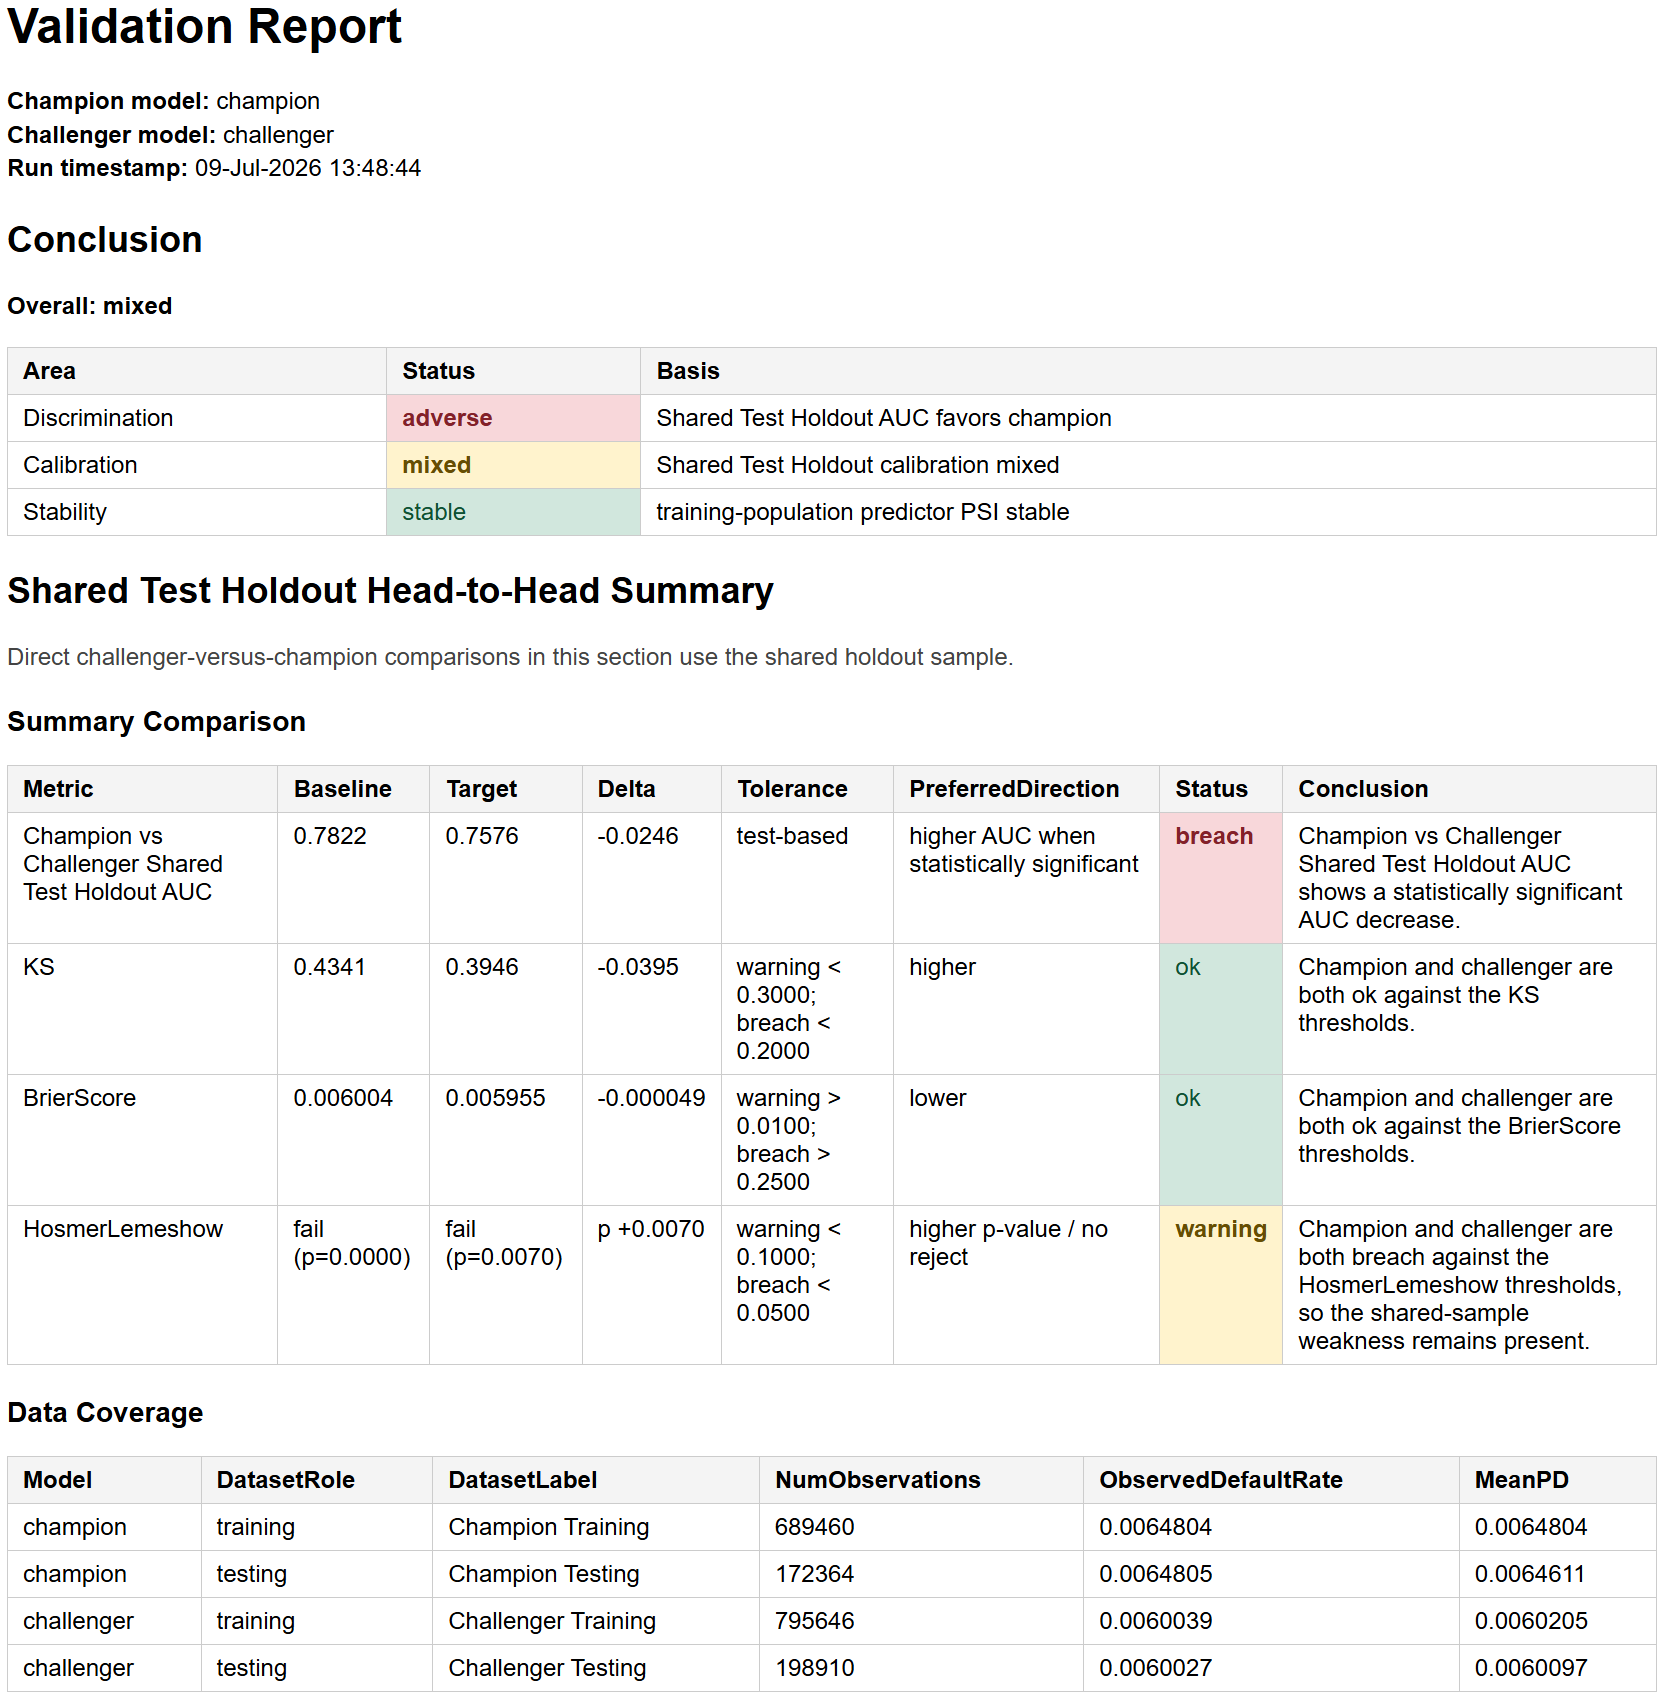
The validation report compares the champion and challenger on the shared test holdout, combining discrimination and calibration evidence in a single summary view.
The champion model has stronger discriminatory power according to AUC. The Kolmogorov-Smirnov statistic for the challenger is lower but still in the acceptable range. Both models have similar calibration statistics, with the Hosmer-Lemeshow failures appearing in both models. The challenger exhibits general overestimation but without any unusual behavior in April 2020:
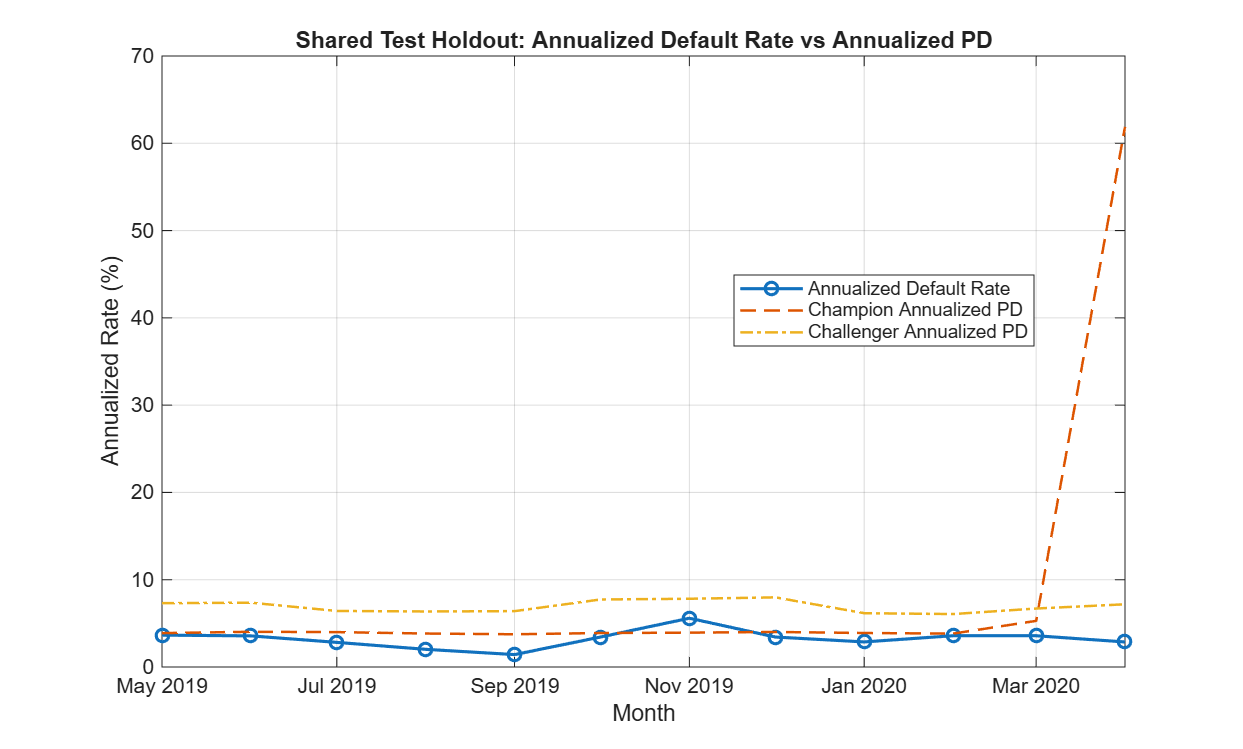
The shared holdout plot shows the champion and challenger against the same observed default rate, making the April 2020 behavior directly comparable.
The evidence must now move through the institution’s governance process. The model owner and business users assess the implications for the model’s intended use and propose an appropriate response. Independent validation and model risk challenge the diagnosis and assess whether continued use, enhanced monitoring, recalibration, redevelopment, or replacement is consistent with policy. Internal audit may subsequently evaluate whether the framework and associated controls operated effectively.
Conclusion and Next Steps
The current MATLAB implementation addresses selected governance questions raised by SR 26-2 and discussed earlier in this series. Aspects of model risk judgment, namely, statistics, thresholds, flags and supporting analysis, are exposed in a repeatable, transparent, and challengeable package. The implementation itself is sufficiently lightweight to be adapted to new models quickly. The underlying risk.validation package supports a flexible collection of metrics well-suited for the more dynamic model risk environment suggested by SR 26-2.
The monitoring and validation workflows described here should be regarded as an initial attempt to answer the question: How can we use MATLAB to help us support the expectations and governance questions raised by SR 26-2? However, there is more work to be done. Some ideas to make this framework production-ready include:
- The risk.validation package supports additional discrimination and calibration metrics. Those, or other custom metrics, should be added to the report based on institutional and validator preferences.
- SR 26-2 stresses the importance of materiality. Our simulated data does not include simulated balance history, but such information should be easily incorporated into the monitoring and validation reports for institutions with robust loan-level data.
- While the monitoring and validation runs have a single entry point, the underlying repository has not yet been integrated with a true automated CI/CD system. That may be desirable for individuals interested in pursuing automation, such as scheduled monthly runs or automatic validation based on any model change.
- We relied on the MATLAB Agentic Toolkit and domain-specific skills while creating the underlying repository. Distilling agents and skills from our work here may help users jumpstart their own monitoring and validation work.
If you are interested in any of these topics, or have any questions at all about MATLAB, risk management, and SR 26-2, please contact us.
- 类别:
- Risk Management


评论
要发表评论,请点击 此处 登录到您的 MathWorks 帐户或创建一个新帐户。