
Modeling Physical Climate Risk Across Financial Portfolios
Financial institutions are reassessing long-term risk models as physical climate events like hurricanes, floods, and wildfires become more frequent and more severe. Traditional natural catastrophe (NatCat) models, which typically address near-term insured losses, do not fully capture the decades-long horizon or the systemic financial effects of chronic climate shifts.
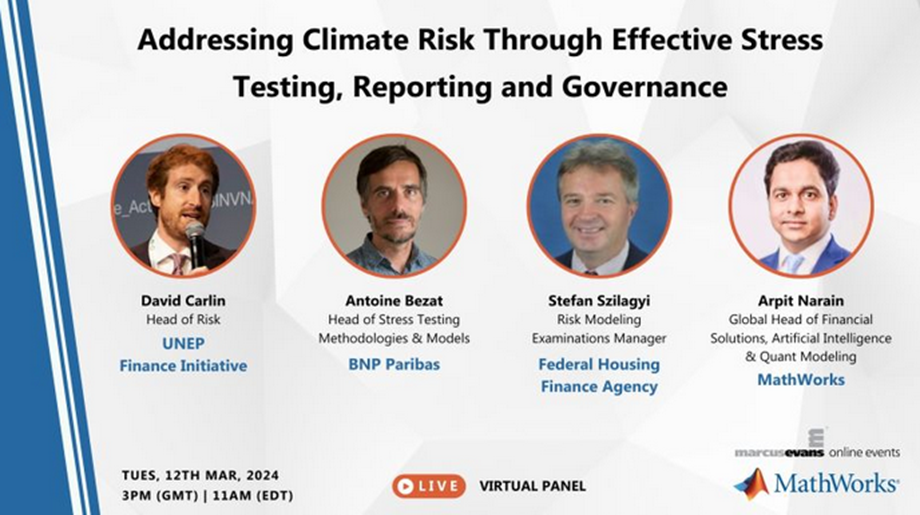
In a recent webinar, Assessing Physical Climate Risk: Implications for Financial Institutions, Stuart Theakston and Annika Huprikar from MathWorks demonstrated how firms can extend NatCat models to simulate climate-conditioned events—such as future hurricanes—and quantify their impact on assets, firm valuations, and investor portfolios.
Watch the recorded webinar to see the complete demonstration.
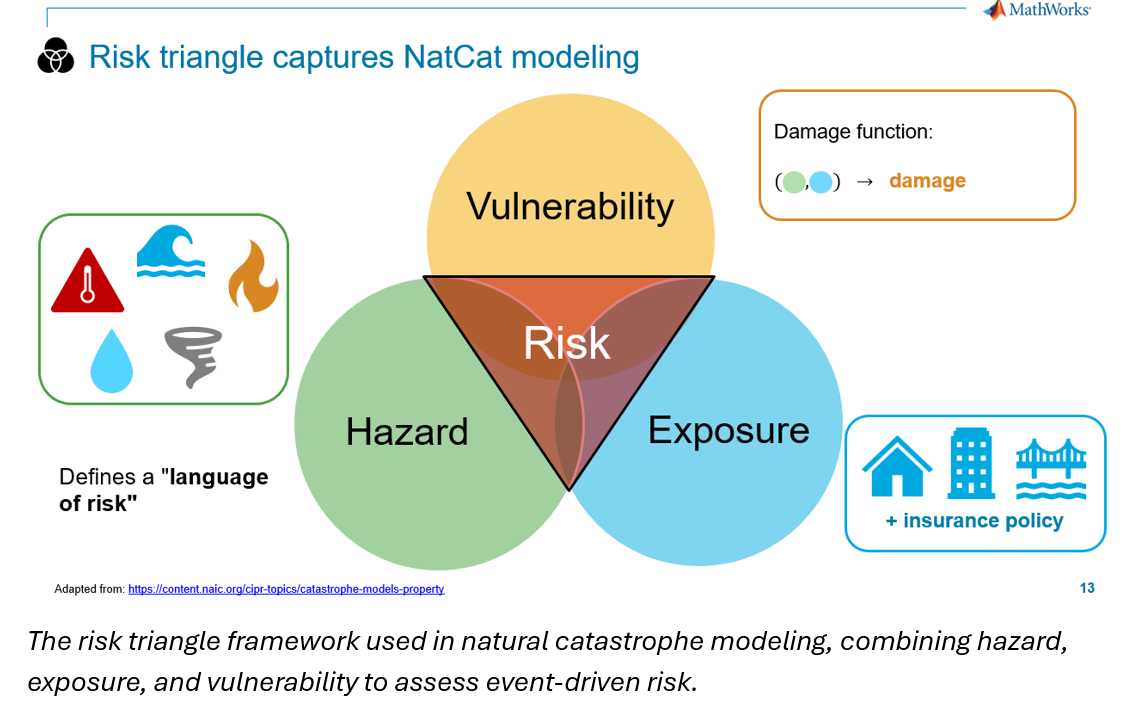
Understanding the Risk Triangle
A foundational concept in climate risk modeling is the risk triangle, which combines three components:
- Hazard – the nature and intensity of the event, such as wind speed or flood depth
- Exposure – the physical or financial assets potentially affected
- Vulnerability – the sensitivity of the assets to the hazard, including resilience measures
This framework is commonly used in insurance modeling. But to support forward-looking financial risk analysis, it must evolve to include climate scenario conditioning and long-term asset value impacts.
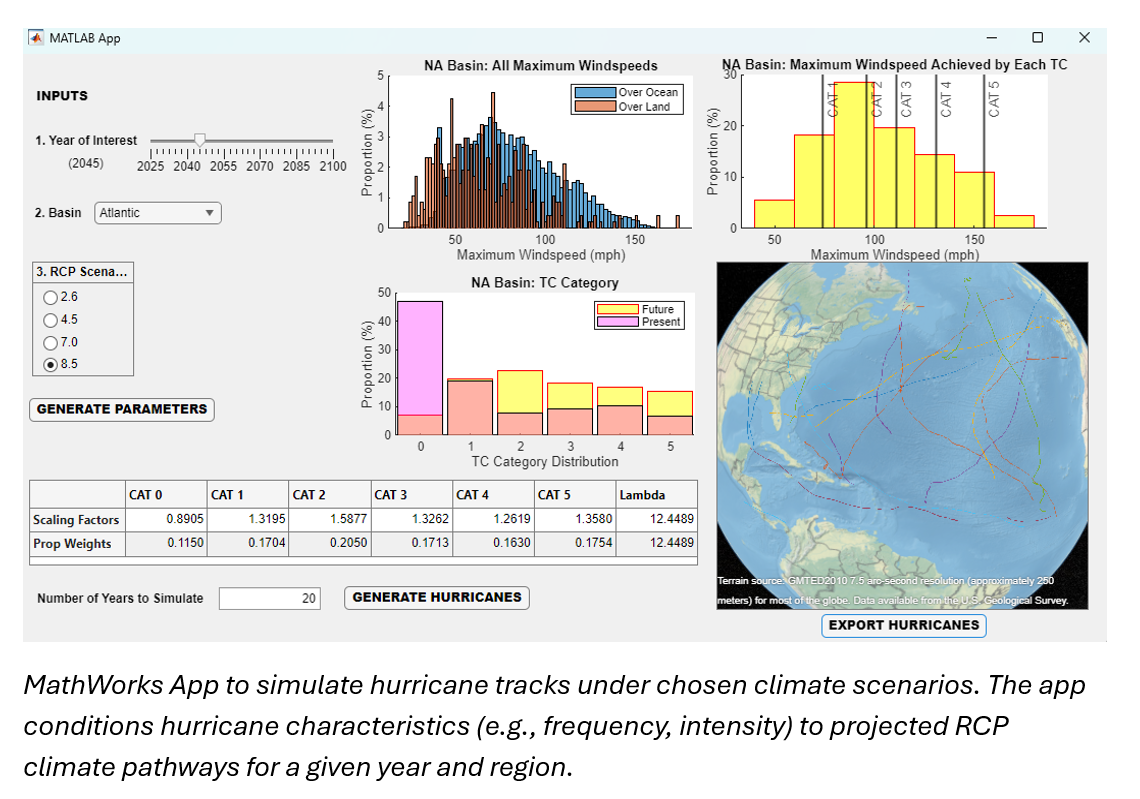
Simulating Future Hurricanes Using Climate Scenarios
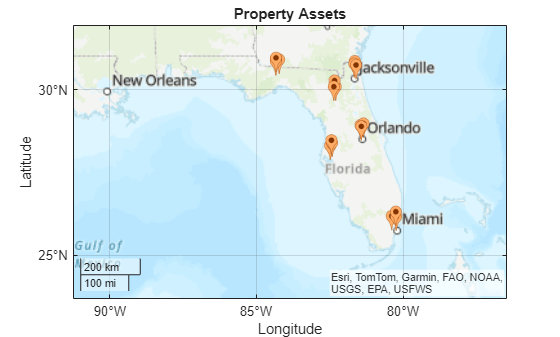
The demo focused on hurricane risk under different climate scenarios (RCPs). Using MATLAB, the team generated synthetic storm tracks for a chosen year (e.g., 2045) and intensity profile aligned with RCP 8.5, a high-emissions scenario. These were then simulated against a synthetic portfolio of coastal assets.
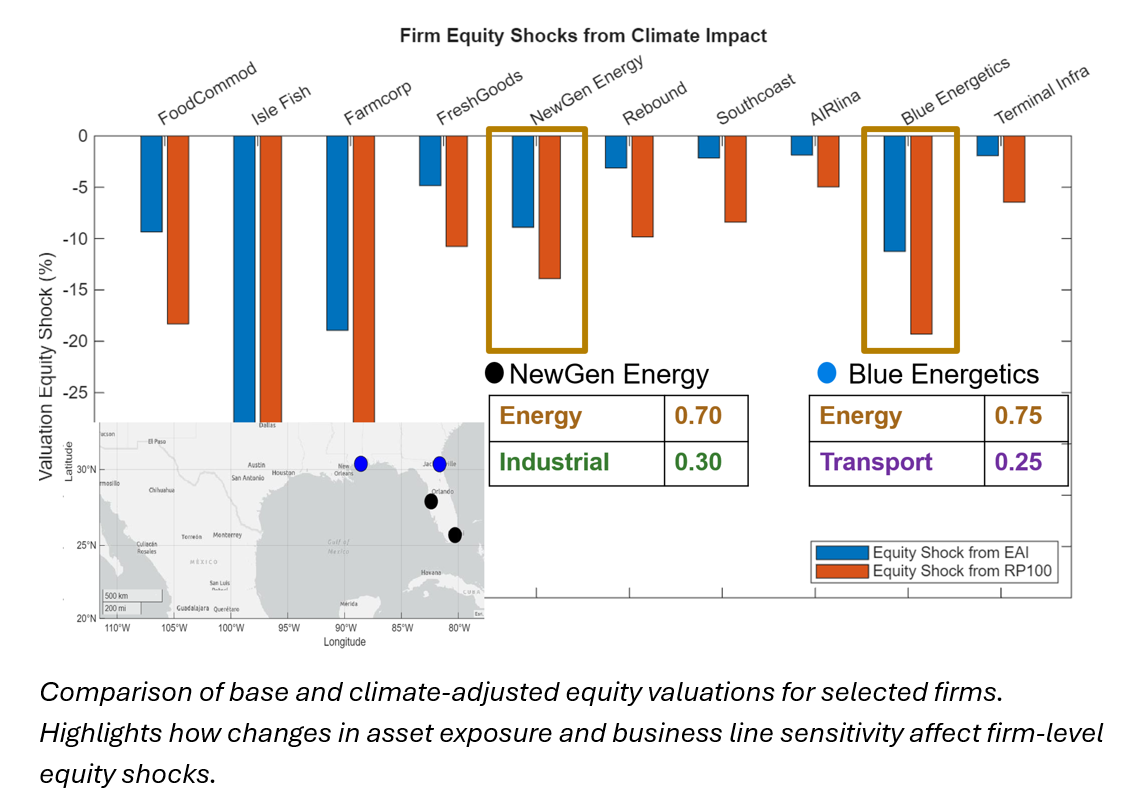
By analyzing damage distributions across assets, the model outputs two key risk metrics:
- Expected Annual Impact (EAI) – the average projected damage
- Return Period (RP100) – the 99th percentile of damage, representing tail risk
From Asset-Level Damage to Firm and Investor Impacts
The demo extended risk analysis beyond physical damage. A Climate Discount Dividends Model (CDDM) was used to calculate how both acute risks (storm damage) and chronic risks (sector output changes under climate stress) affect firm equity valuations.
These adjusted valuations were then rolled up into investor portfolio-level equity shocks, showing how different investment allocations lead to varied risk outcomes—even under the same climate scenario.
Why Start Now?
This modeling approach enables firms to:
- Align climate risk analysis with NGFS and other regulatory scenarios
- Quantify long-term impacts on value, not just short-term insured losses
- Incorporate local hazard data, physical exposure, and firm-level financials
- Inform portfolio construction, capital planning, and disclosures
All of this can be done using MathWorks tools for climate modeling, financial analytics, and geospatial data processing—within one transparent, customizable environment.
Talk to Us
To learn more about modeling physical climate risk in MATLAB, watch the full webinar recording, or get in touch at climatefinance@mathworks.com.


コメント
コメントを残すには、ここ をクリックして MathWorks アカウントにサインインするか新しい MathWorks アカウントを作成します。