
Advanced Control of Size and Layout of Exported Graphics
 |
Guest Writer: Leia Rich Leia is a software engineer on the MATLAB Charting Team. She first joined MathWorks as part of the Engineering Development Group (EDG) in 2022, and later became a developer contributing to the graphics infrastructure area and exporting. Outside of MathWorks, Leia enjoys traveling and photography. |

Have you ever wanted to export your graphics and wished there was an easy way to specify the output size without having to adjust Paper properties on the figure for print or use tiledlayout?
Well now there's an easier way with new name-value pairs available for MATLAB Desktop and MATLAB Online in R2025a. Let's take a look at some of these changes to the exporting functions by using a plot of some exercise data that I collected when walking and running.
Download distanceAndHeartRateTables.mat
load("distanceAndHeartRateTables.mat")
scatter(walkTbl, "Distance", "AvgHeartRate", "filled", "DisplayName", "Walking");
hold on
scatter(runTbl, "Distance", "AvgHeartRate", "DisplayName", "Running");
xlabel('Distance (m)')
ylabel('Average Heart Rate (bpm)')
legend(Location='northeast')
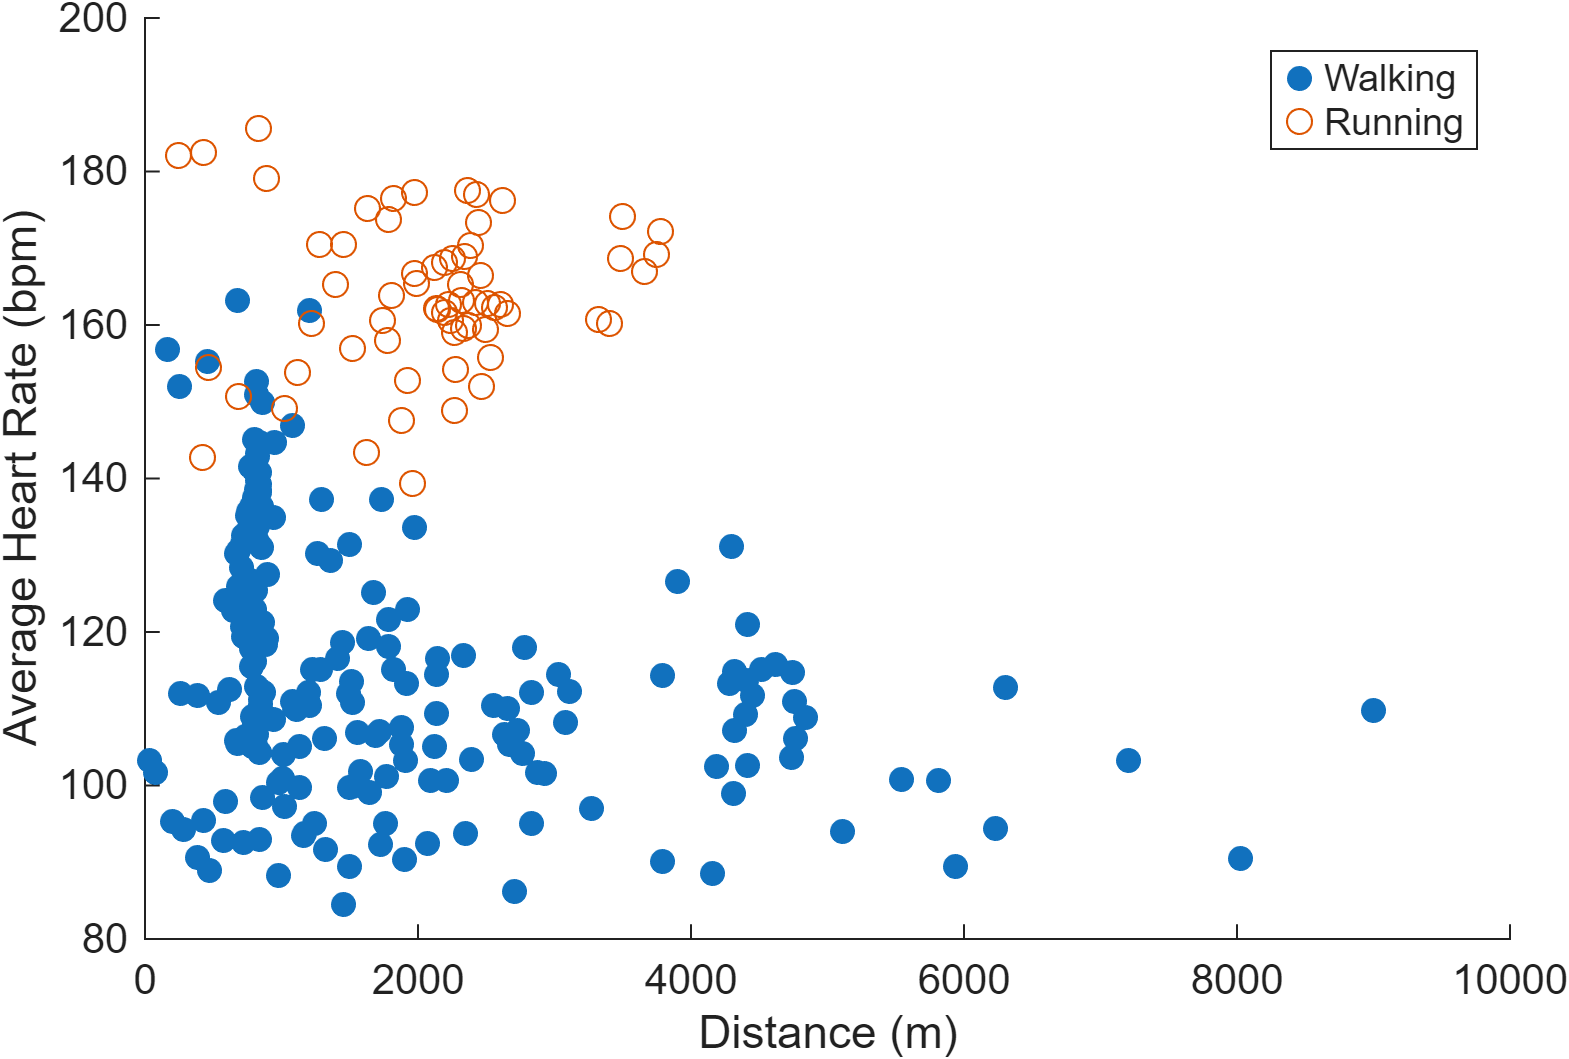
There's no surprise that running resulted in a higher heart rate. Let's use this plot to dive into new ways to control the output size of your exported graphics.
Old way to specify size using print
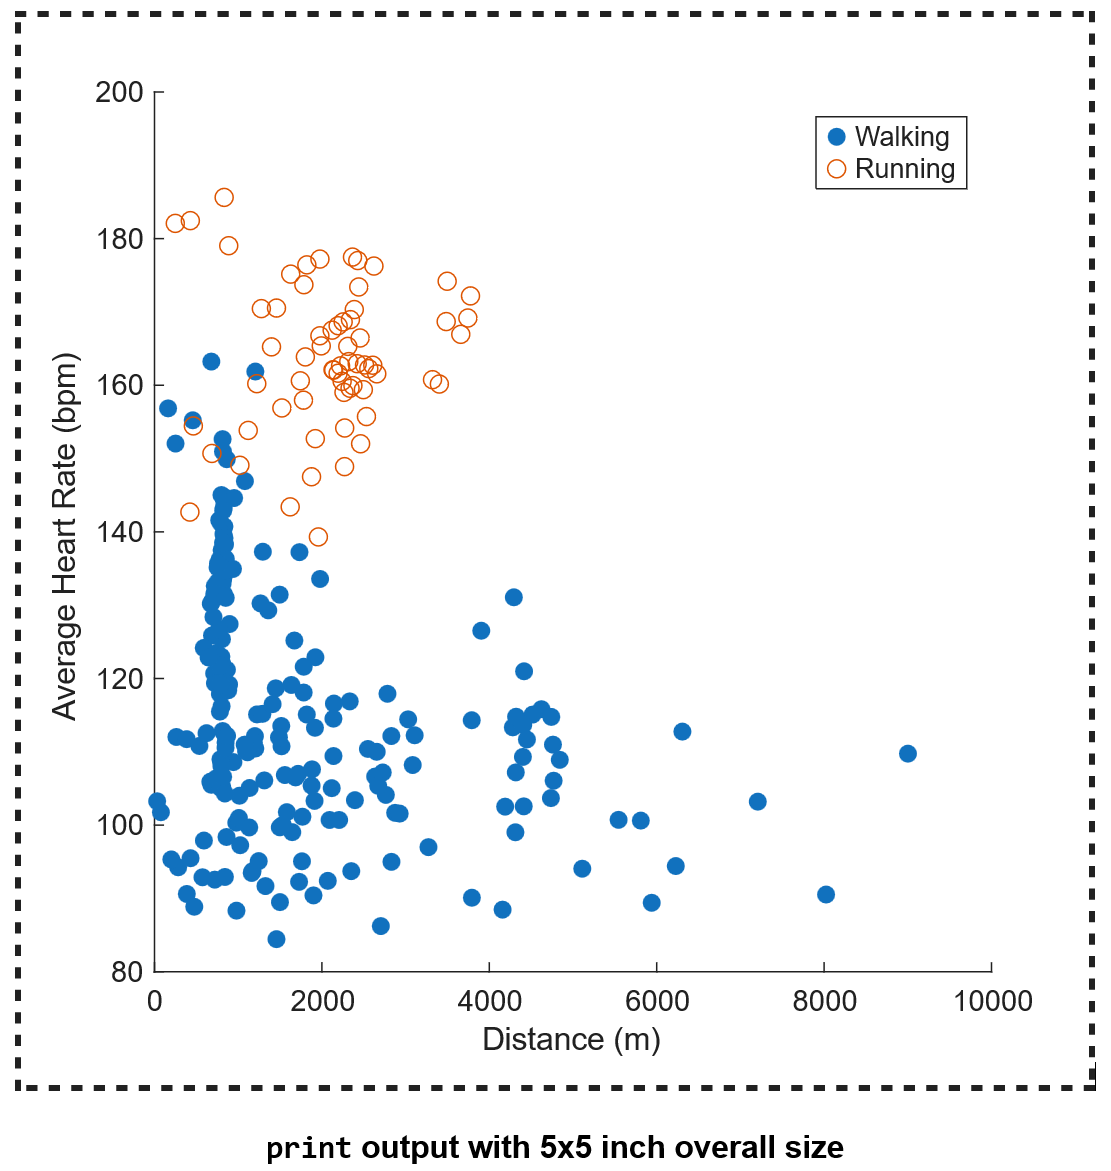
One of the ways to specify the exported size that you may be familiar with is by adjusting the Paper properties on the figure. For example, if we want to print to a SVG file with a 5 inch width and 5 inch height, we can set the PaperUnits to 'inches' then set the width and height on the PaperPosition both to 5.
set(gcf,'PaperUnits','inches')
set(gcf,'PaperPosition',[0 0 5 5])
print(gcf, 'printToSVG.svg', '-dsvg')
The resulting SVG file looks like the image below, with the width and height both being 5 inches. The dashed line indicates the edge of the SVG file. Changing the PaperPosition changes the output size when using print, however, this does not impact the output when using exportgraphics. Below, we'll explore the new name-value pairs that allow you greater control of the output size when exporting.
New way to specify size using exportgraphics
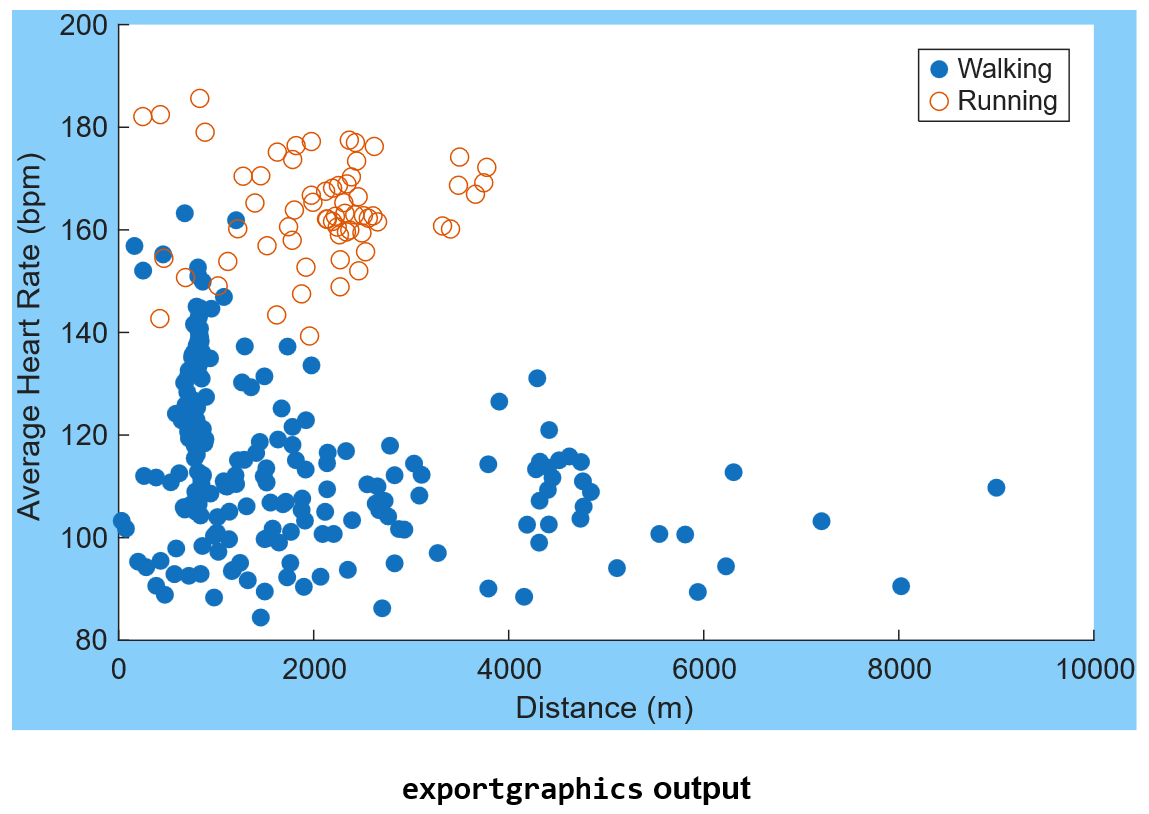
Let's do an initial export of this plot using exportgraphics. Let's export it to SVG since exportgraphics supports this format starting in R2025a. We'll specify a background color when exporting so it is easier to compare the full output size.
exportgraphics(gcf,'exportToSVG.svg', BackgroundColor=[0.53 0.808 0.98])
This is what the resulting SVG file will look like:
Specifying export size
The output matches the aspect ratio of the original figure, but it does not have the dimensions that we want. If we want to get a square output, we can specify the width and height of the SVG file using the Width, Height, and Units name-value pairs.
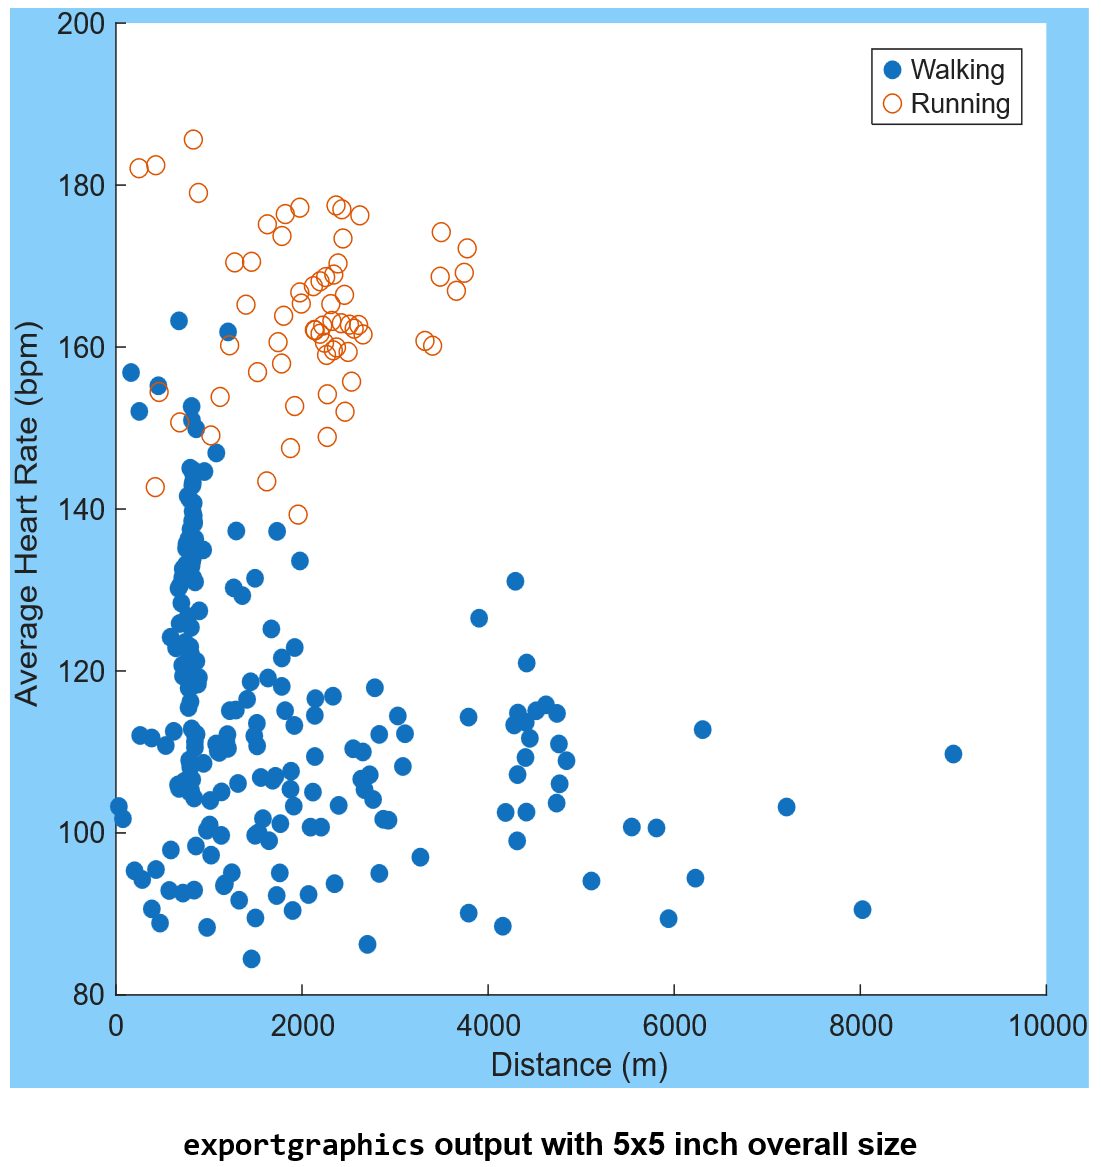
exportgraphics(gcf,'exportToSVGSquare.svg',Width=5, Height=5, Units='inches', BackgroundColor=[0.53 0.808 0.98])
Looking at the SVG output below, you'll notice it looks similar to what we got using print with the Paper properties set on the figure. Both outputs have overall sizes of 5 inches by 5 inches, however, the padding between the axes and the edges of the SVG file is less when using exportgraphics. exportgraphics by default exports using 'tight' padding. Padding is one of the new name-value arguments, which allows you to specify the amount of space between the outer edge and the outside of the decorations. Let's explore this name-value argument next.
Adjusting the padding around the export
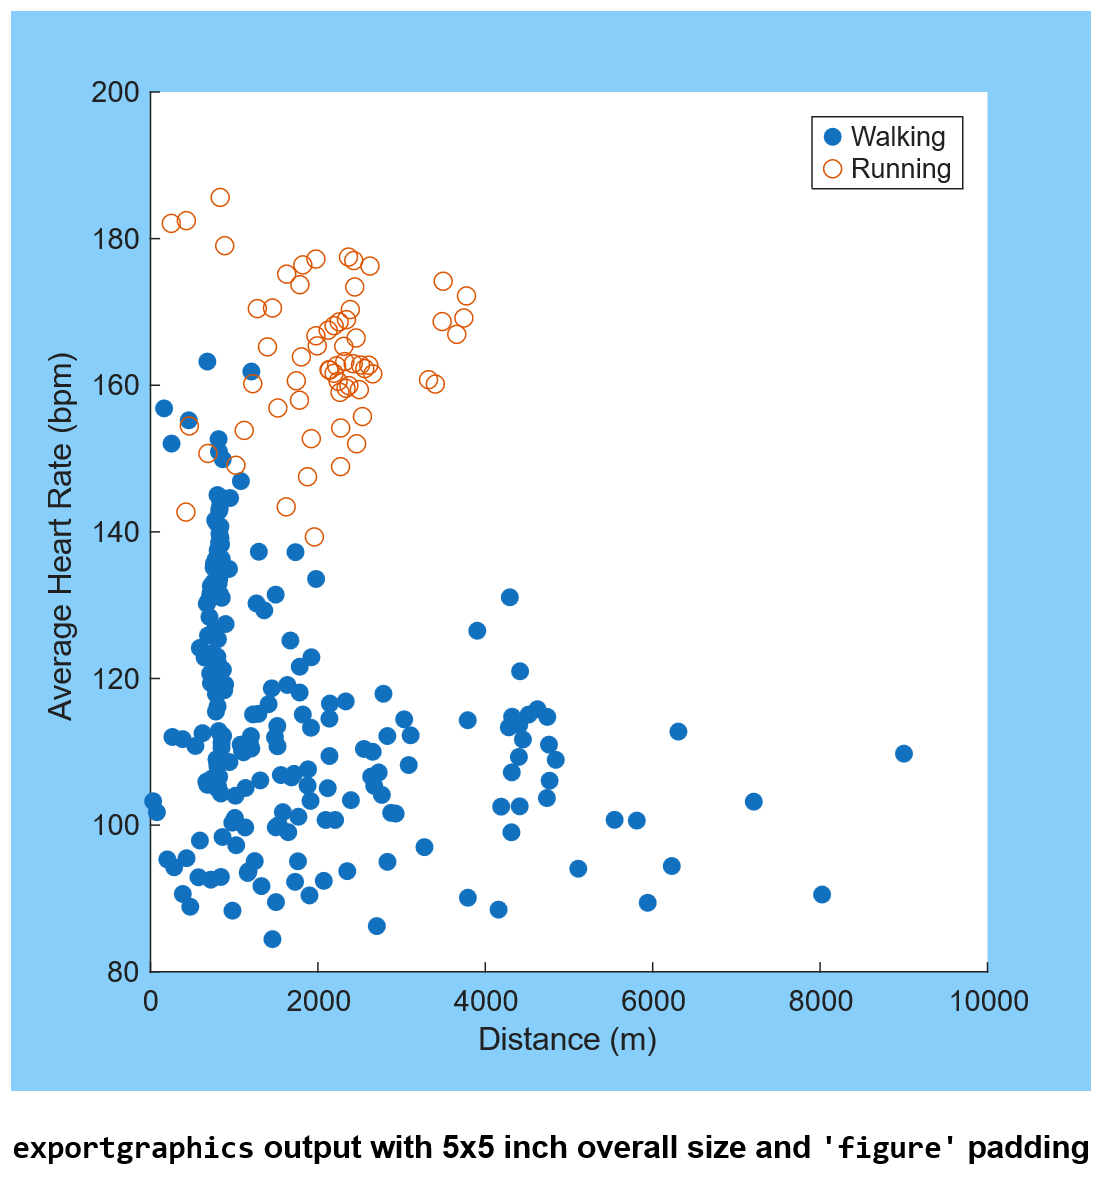
Let's try adjusting the padding to match the output we got using print more closely. This can be done by setting the Padding to 'figure', which includes the same relative amount of padding that appears in the figure window.
exportgraphics(gcf, 'exportToSVGFigurePaddingSizeSpecified.svg', Padding='figure', Width=5, Height=5, Units='inches', BackgroundColor=[0.53 0.808 0.98])
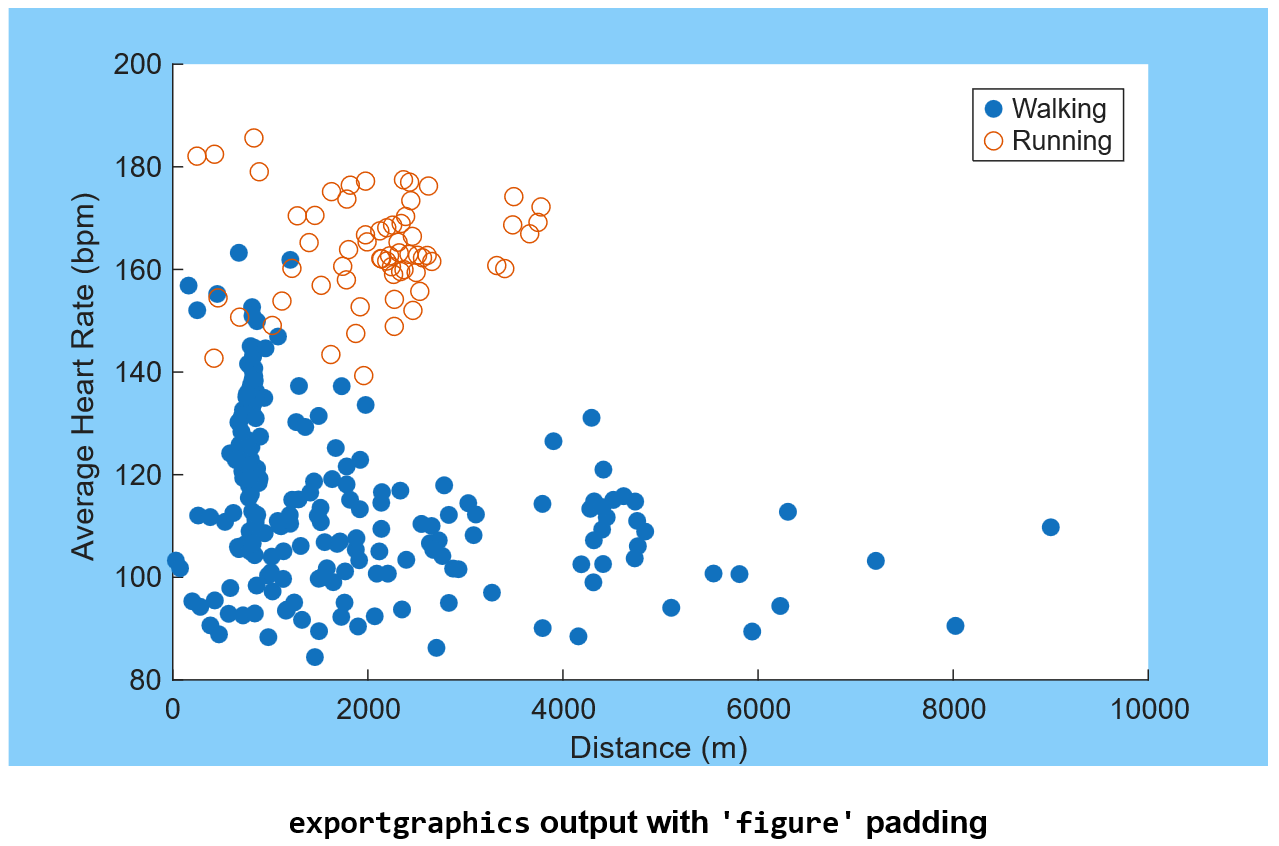
You can also adjust the padding without specifying a Width or Height.
exportgraphics(gcf, 'exportToSVGFigurePaddingSpecified.svg', Padding='figure', BackgroundColor=[0.53 0.808 0.98])
This syntax preserves the amount of padding that we see in the figure window.
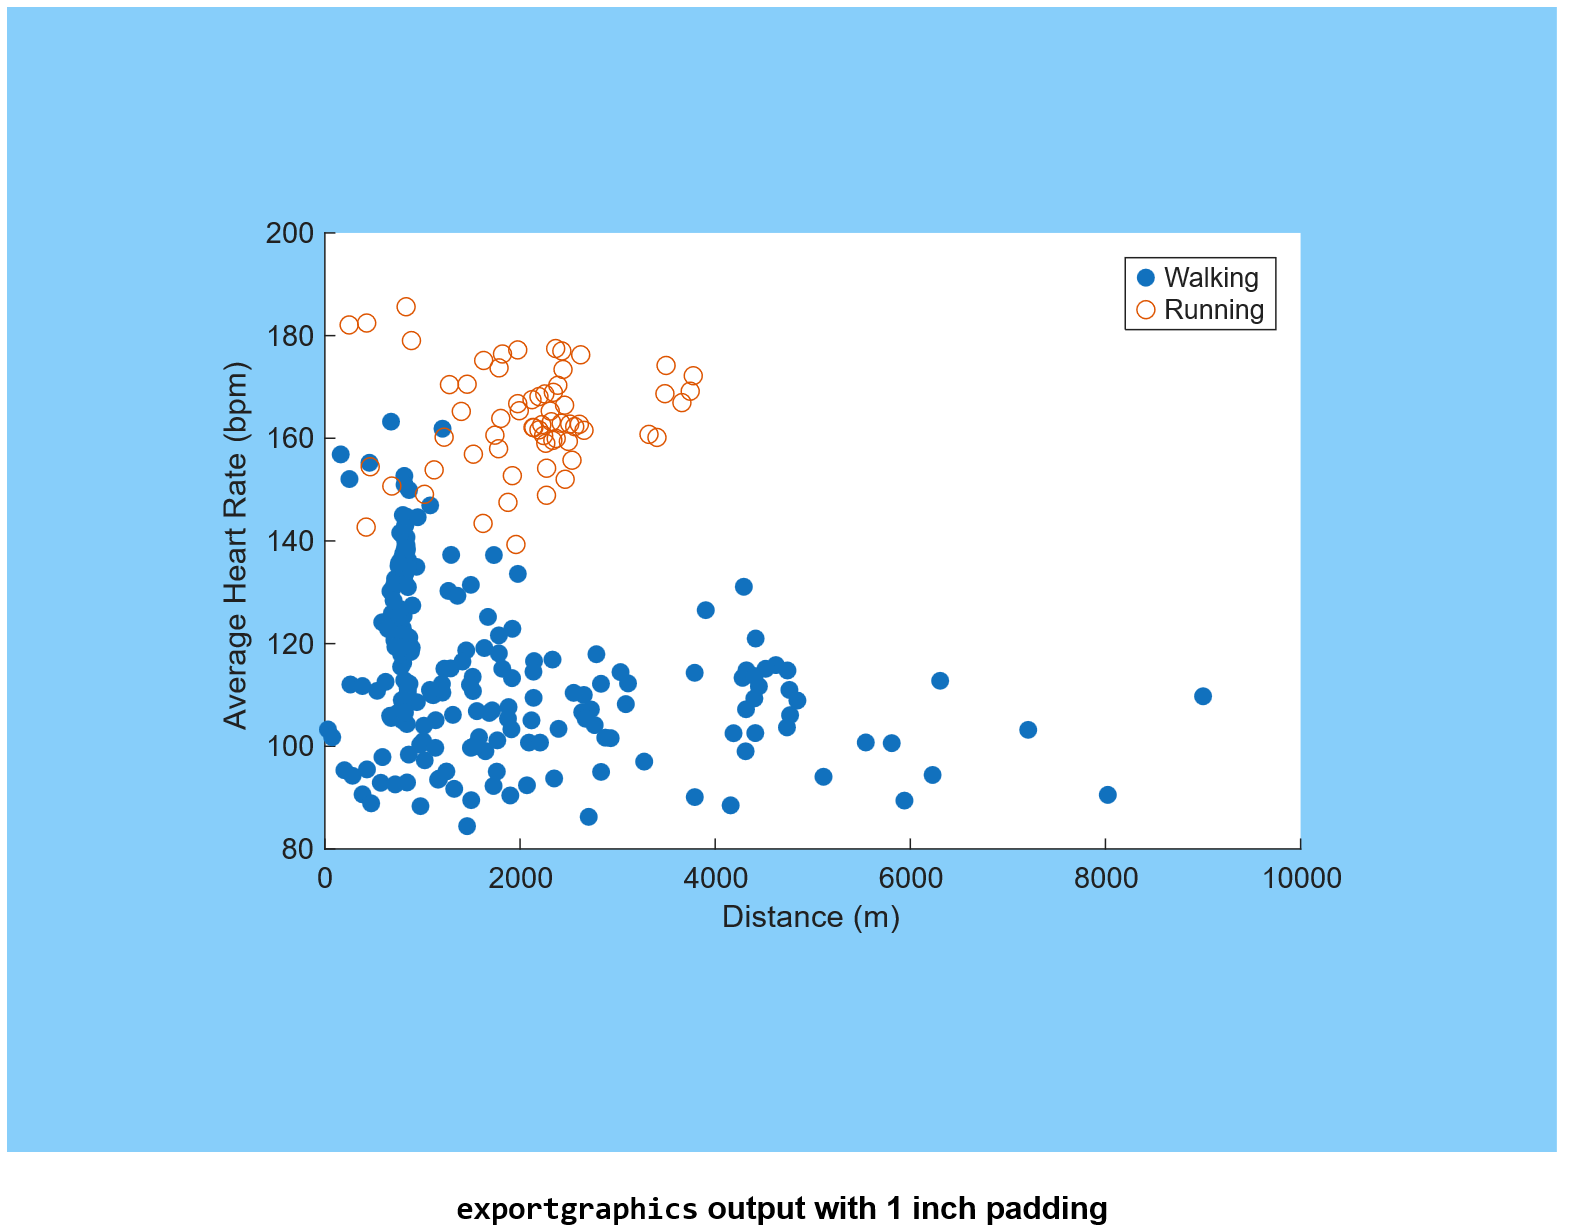
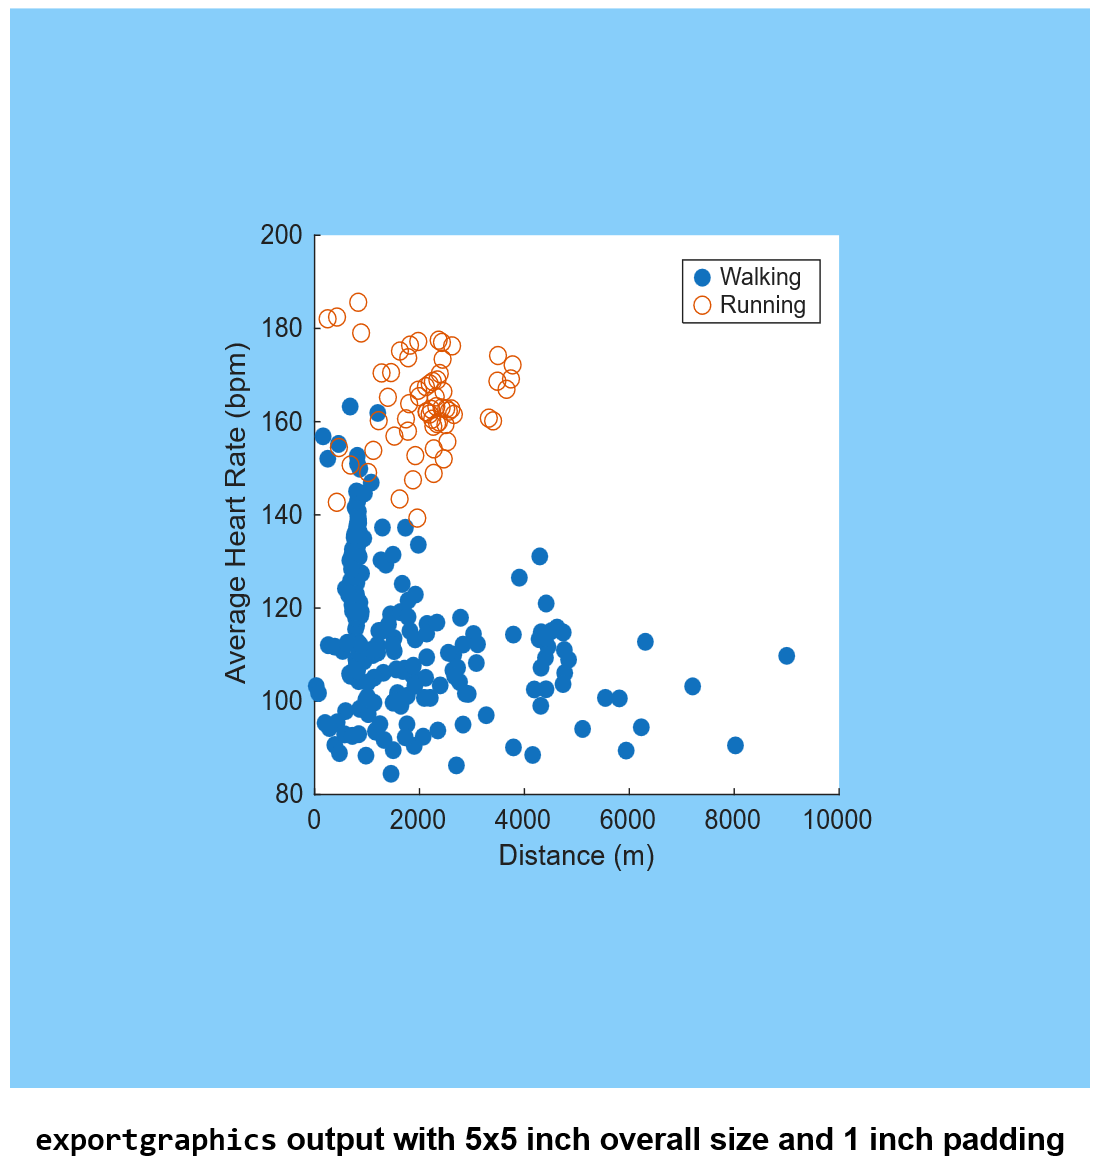
What if you want a specific amount of padding around all 4 sizes? You can specify a numeric value for the padding too. The Units name-value pair that we have used for the Width and Height previously is also used for Padding. Let's try adding 1 inch of padding around each side.
exportgraphics(gcf, 'exportToSVGPaddingSpecified.svg', Padding=1, Units='inches', BackgroundColor=[0.53 0.808 0.98])
When specifying both the size and padding, the padding is included in the overall requested size. So if we specify an output size of 5 inches by 5 inches, and we also want 1 inch of padding, the padding is included inside the 5 inch by 5 inch output.
exportgraphics(gcf, 'exportToSVGPaddingSizeSpecified.svg', Padding=1, Width=5, Height=5, Units='inches', BackgroundColor=[0.53 0.808 0.98])
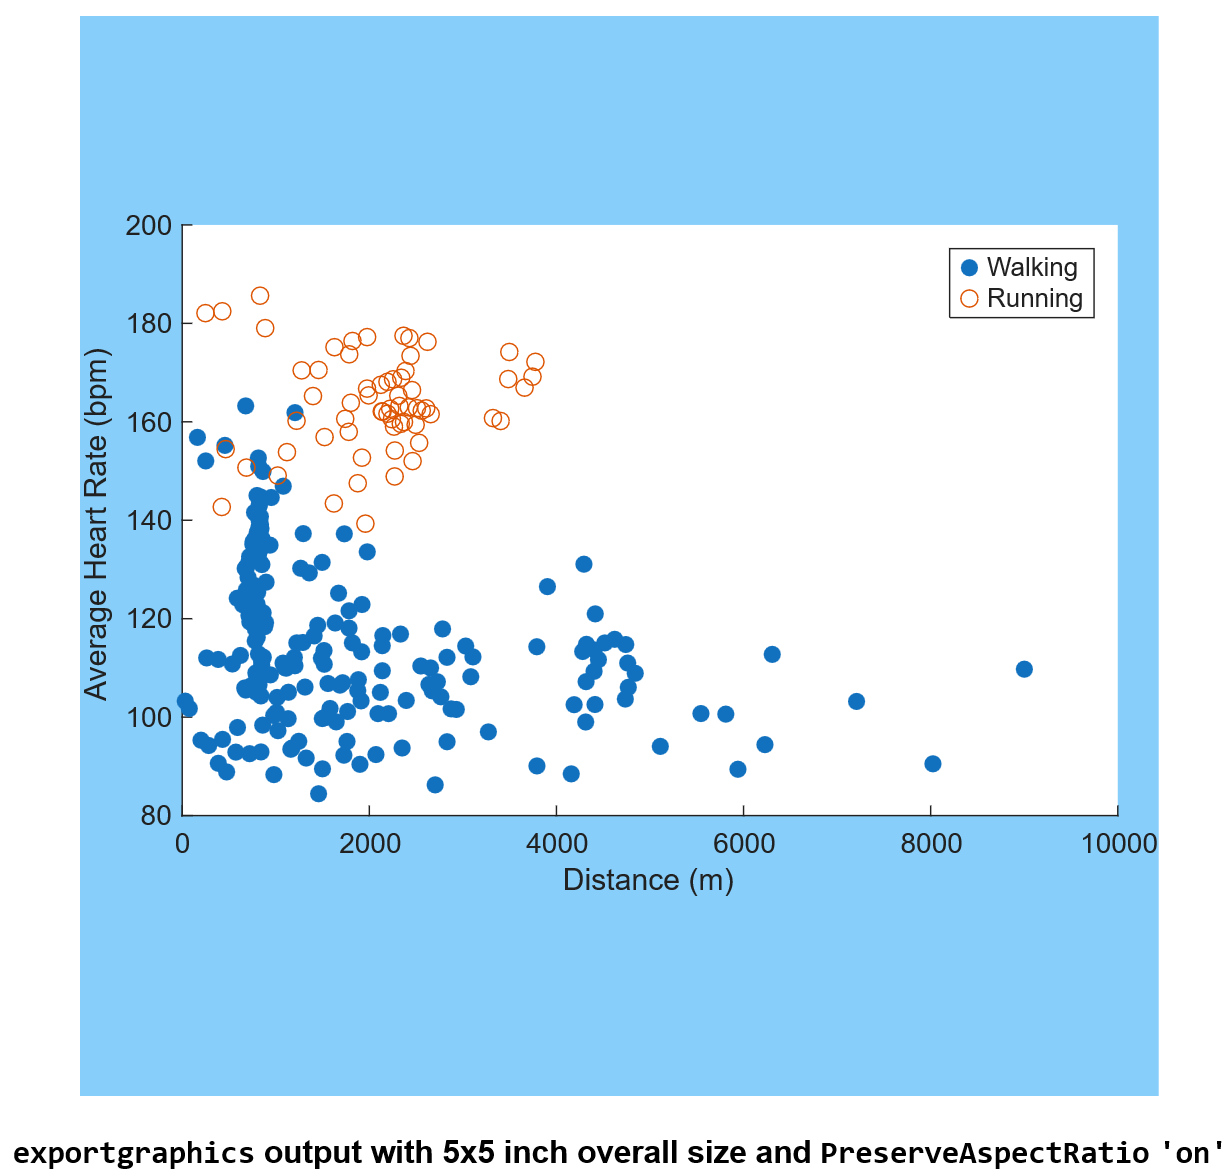
Preserving onscreen aspect ratio when specifying size
When specifying an output size, you might want the aspect ratio to be the same as what is seen in the figure window. We can maintain the original aspect ratio by specifying the name-value pair PreserveAspectRatio to be 'on'. This will make it so that the output size is the requested 5 by 5 inches, but with extra padding added to the top and bottom to preserve the aspect ratio.
exportgraphics(gcf, 'exportToSVGPreserveAspect.svg', Width=5, Height=5, Units='inches', PreserveAspectRatio='on', BackgroundColor=[0.53 0.808 0.98])
These new name-value pairs are also available for copygraphics, allowing you to easily specify the dimensions and padding when copying to clipboard.
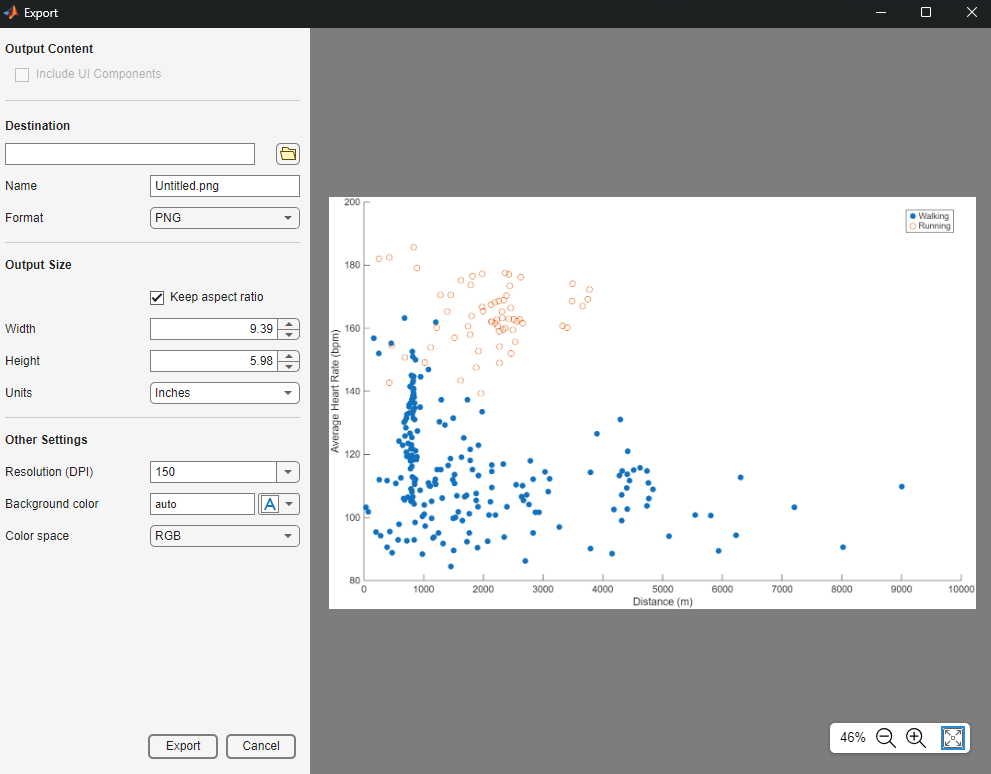
Using dialogs and Copy Figure settings
Now if you would rather use the export dialog so you can see how your output will look beforehand, you can specify these name-value pairs there too! Using the uiexportdlg, you can specify the width and height, as well as the aspect ratio. This is what the export dialog looks like when we open it up for the figure:
Now if we want to update the settings, we can see it reflected in the preview for the export. Let's use the same 5 inch by 5 inch output size that we have been using and set the background color to light blue before exporting it to SVG. The uiexportdlg will update to look like the below image:
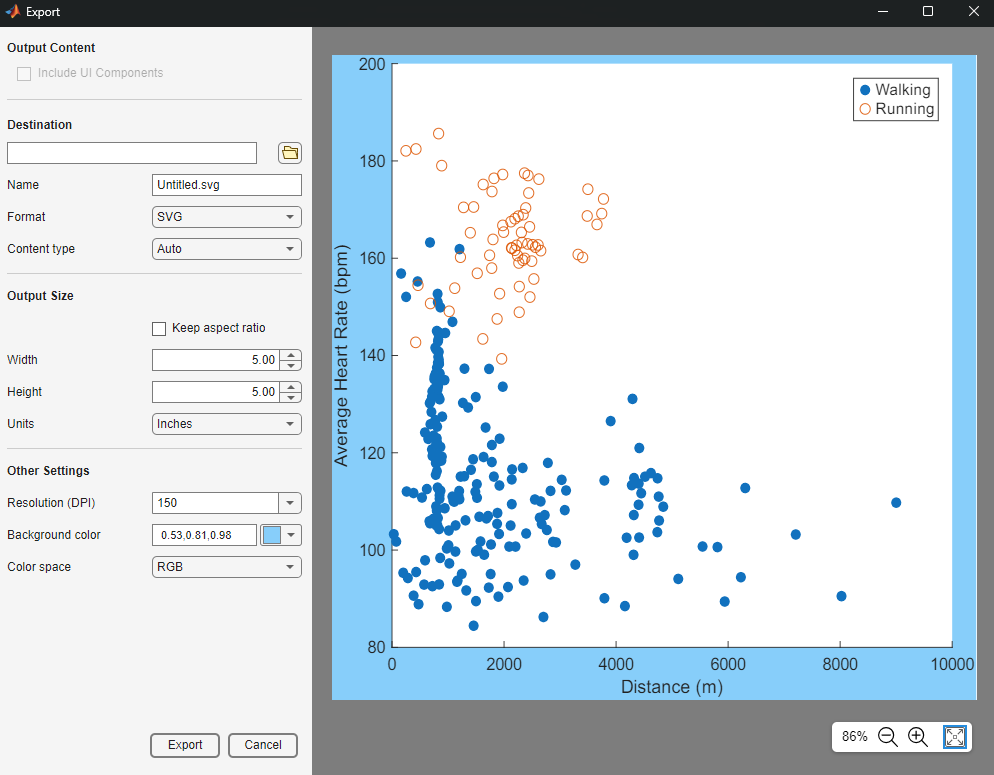
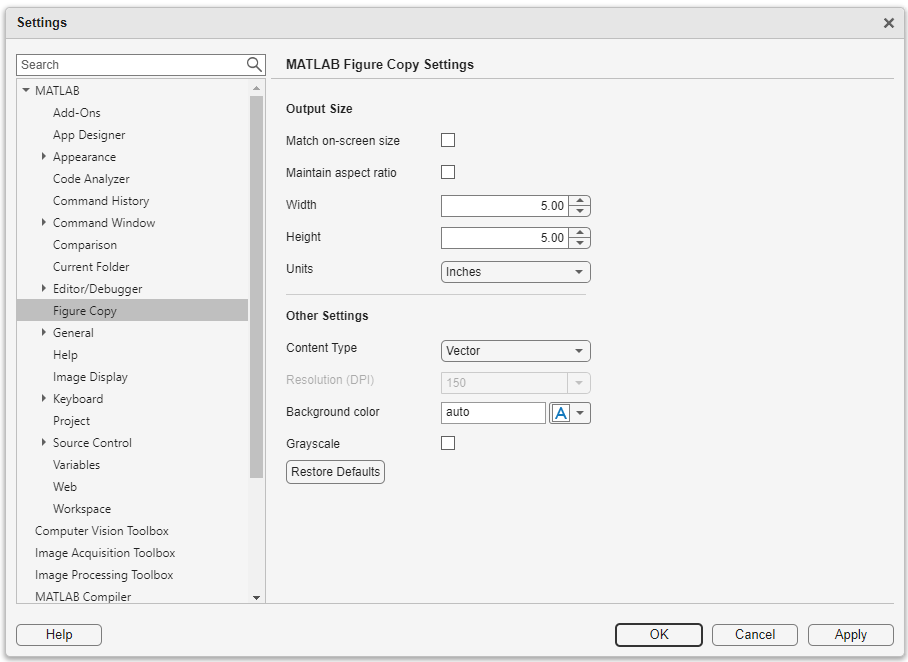
As mentioned earlier, these options are available also for copygraphics. If instead of using the copygraphics command you want to use the Copy Figure option on the figure toolstrip, you can navigate to the Figure Copy Settings. With these settings, you are able to specify the size and if you want to preserve the aspect ratio. These settings will be used if you press Copy Figure in the figure toolstrip.
Conclusion
To recap, exportgraphics and copygraphics now support specifying output size, as well as support some additional functionality that allows you control over maintaining the aspect ratio and the padding. Previously, you may have used print to specify output size by using the less intuitive method of changing properties on the figure before printing, which also did not allow as much control as the new name-value pairs.
Please leave a comment and let me know what additional exporting features you're interested in having us work on in the future!


See Also
-

Making Pretty Graphs
Blogs
-
-
-

评论
要发表评论,请点击 此处 登录到您的 MathWorks 帐户或创建一个新帐户。