
2025 Year In Review: Graphics and App Building
It was a big year for the MATLAB Graphics and App Building blog, from announcing a brand‑new WebGL‑based graphics system to introducing dark theme, modern figure tools, and updated app workflows. This article is a quick 2025 recap so you can quickly spot anything you might have missed and jump straight into the articles that are most relevant to your projects.
Thanks to everyone who read, shared, and commented on the blog throughout 2025. Your feedback is heard and carefully routed to the teams shaping graphics and app building projects. If this recap surfaced a few posts you missed, consider following the MATLAB Graphics and App Building blog so you’ll be first to see the next round of features, tips, and demos in 2026.
New foundations for graphics and apps
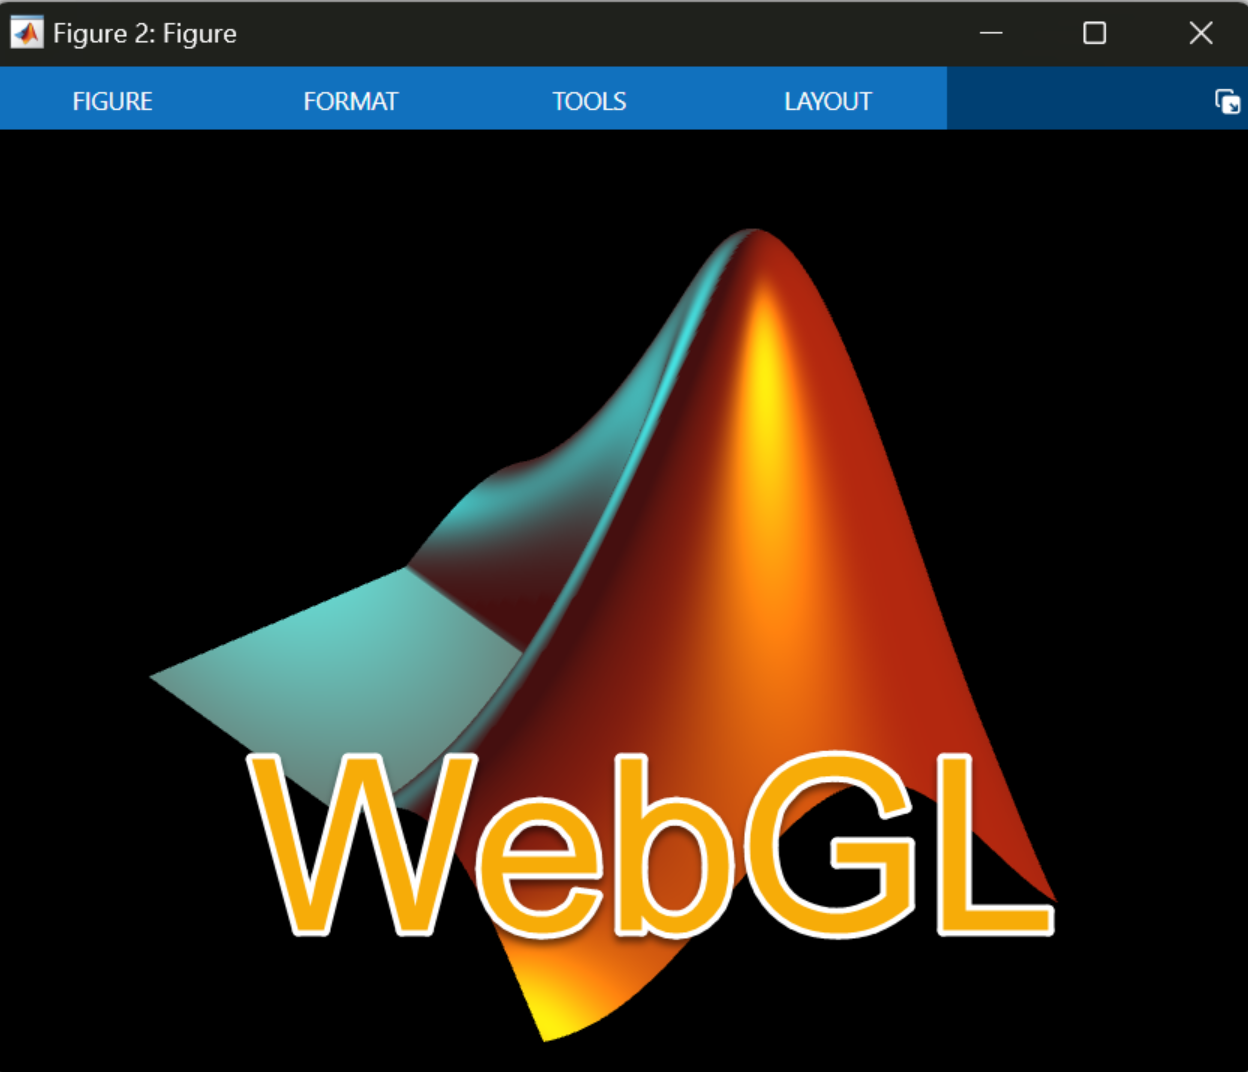 |
MATLAB R2025a introduced a new WebGL‑based graphics system, replacing the long‑standing Java-based renderer and enabling more robust and performant graphics. |
Friendlier figure layout and tools
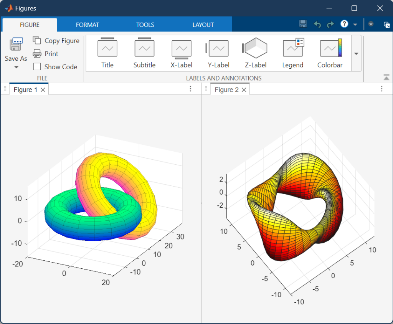 |
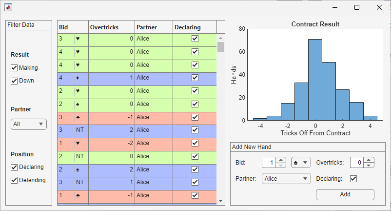
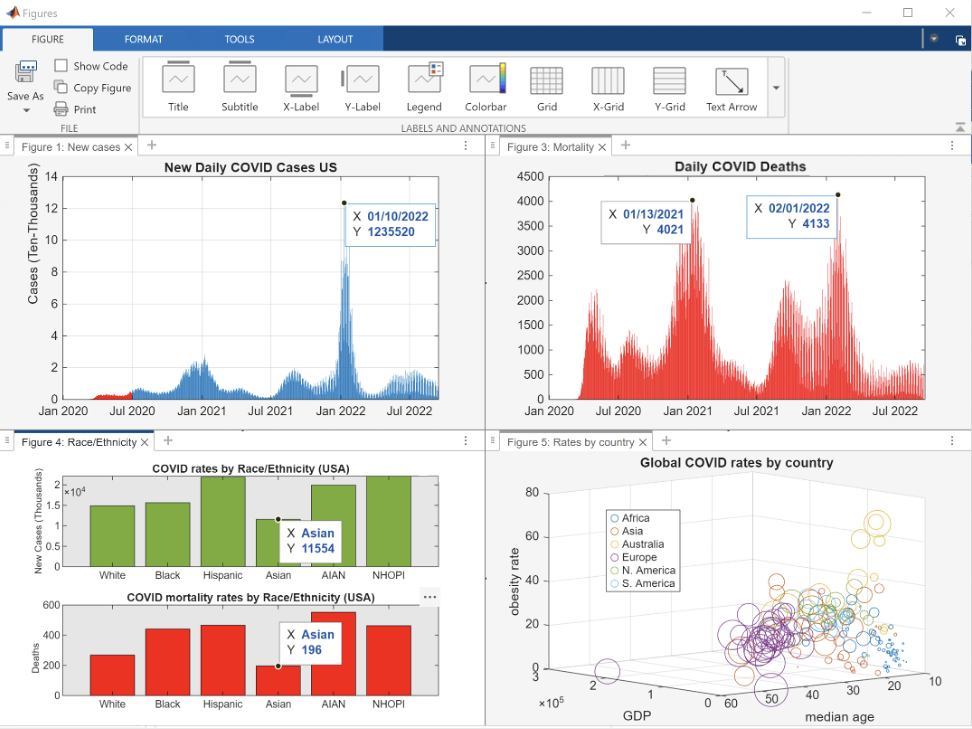
The new tabbed figure container added tiling, docking options, and flexible layouts, making it easier to compare visualizations and manage multi-figure workflows. A redesigned figure toolstrip focused on user workflows, interactive editing, and automatic code generation, making it easier to both explore data and capture reproducible code. |
Dark and light themes
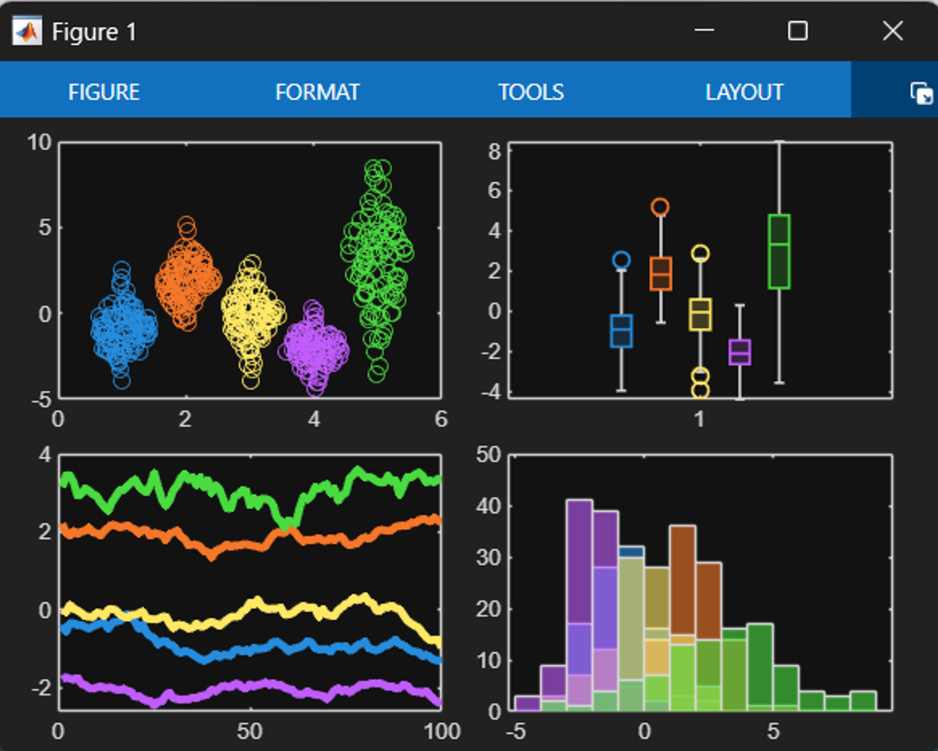 |
Dark theme arrived for charts and apps, along with a default color system that adapts to the current theme so apps and visualizations stay readable in both light and dark environments. A guide to themes shows chart and app authors how to design for a specific theme or build experiences that adapt gracefully when the theme changes. |
New charts, new capabilities
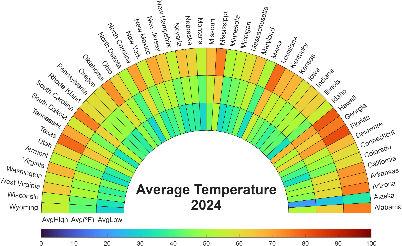 |
Articles on the new violin plot, and patch and surface support in polar axes, highlighted new tools to visualize complex data. |
Modern app workflows
 |
The blog covered the evolution from GUIDE to App Designer, and from uicontrol to UI components, helping teams modernize existing apps and design new ones that scale. |
Polishing charts
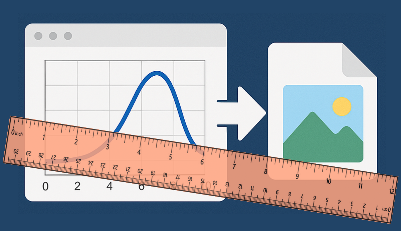 |
Articles on making graphs prettier, easy bar labeling, and advanced control of export size and layout focused on small, practical changes that make figures look publication‑ready with less effort. |
Hands-on demos
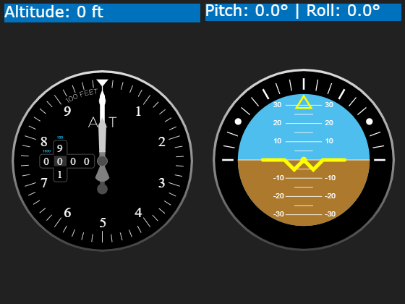 |
Hands-on tutorials such as the flight tracking dashboard and the festive gift‑bow graphics showed how to combine features into real, reusable demos that readers can adapt to their own projects. |
Casting light on advanced graphics
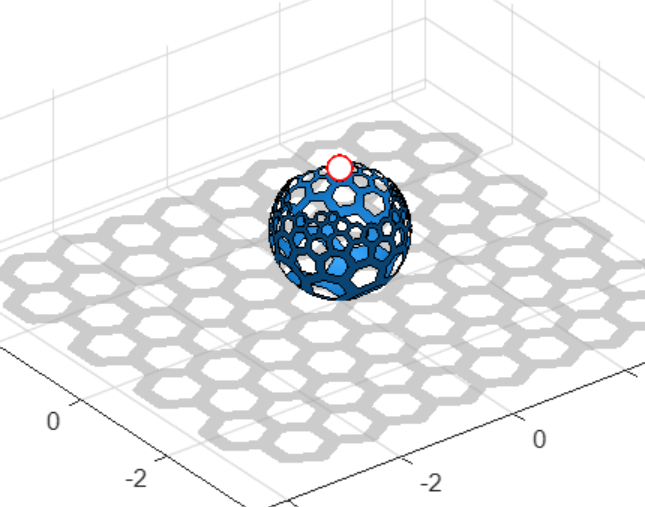 |
The math behind casting shadows and inverse stereographic projections lurks in the shadows of the Graphics and App Building blog 2025 series for readers who enjoy the math behind the visuals. |
Thanks to everyone who read, shared, and commented on the blog throughout 2025. Your feedback is heard and carefully routed to the teams shaping graphics and app building projects. If this recap surfaced a few posts you missed, consider following the MATLAB Graphics and App Building blog so you’ll be first to see the next round of features, tips, and demos in 2026.


评论
要发表评论,请点击 此处 登录到您的 MathWorks 帐户或创建一个新帐户。