ThingSpeak: Your MATLAB-Powered Window on the World
Have you tried ThingSpeak yet? It’s cool, it’s free, and it talks to MATLAB. I like all three of those things. Let me show you how it works.
ThingSpeak is called an “Internet of Things platform”. You can use it to collect data from internet-connected devices, analyze it, plot it, and then use it to kick off some other event. So, for example, you could have a sensor that measures the tide in Ockway Bay and then makes a nice chart and maybe even tweets when the water is deep enough for you to go boating.
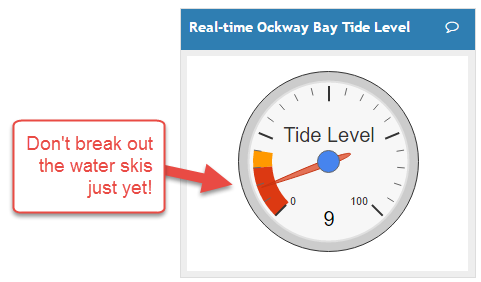
I’m going to use ThingSpeak to sense the environment, but not something as exotic as the tides around Cape Cod. My environment is a web page that shows how many solutions have been submitted to Cody. My sensor is a screen-scraping function that grabs the right number from the page.
My ultimate goal is to make an automatically updated MATLAB plot that shows me the number of new Cody solutions that have come in every day for the past 60 days. To do this, I’m going to use four different ThingSpeak services:
- a timer
- a MATLAB code block to grab the number and store it in a ThingSpeak channel
- the channel itself
- a MATLAB code block to take 60 days worth of data and plot it
Here’s how it all fits together
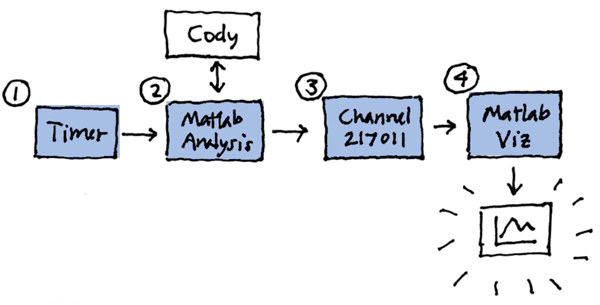
Once a day, the TimeControl app will kick off a MATLAB Analysis app to grab the number of Cody solutions. I’ll take that number and save it to a ThingSpeak channel. Associated with that channel, I’ll have a MATLAB Visualization app that does some further analysis and turns it into a pretty plot.
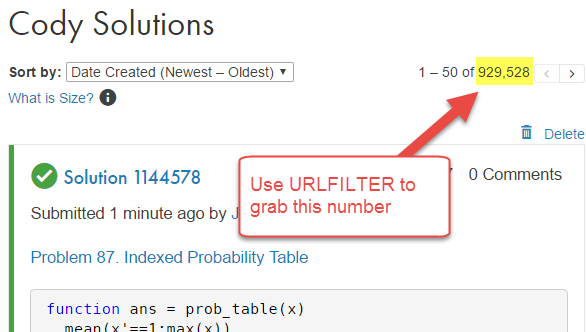
The Cody Solutions page has the number of solutions displayed in the upper right. I use the urlfilter command to grab that number and then push it to the ThingSpeak channel.
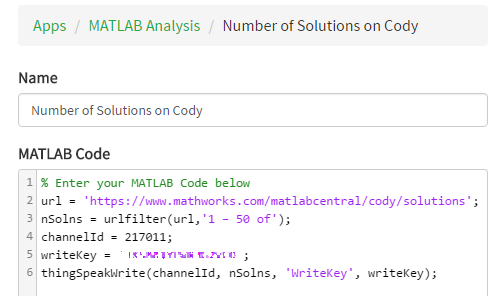
Here’s the code that runs every day on ThingSpeak.
My channel (number 217011) comes with a nice default chart.

I can see that the number is very big and steadily rising. That’s great, but it’s hard to see much detail here. What I’d really like is a plot of the number of solutions submitted per day. This is where the MATLAB Visualization app comes in handy. I want to read in the data and then put it into a timetable. This makes it easy for me to resample it once every day. Once I do this, I can feel confident that the time interval I get when I take the element-by-element difference is always exactly 24 hours. I can plot this daily difference and then include, for good measure, a seven day moving average to wash out any weekly artifacts. All in a handful of lines of code. Look:
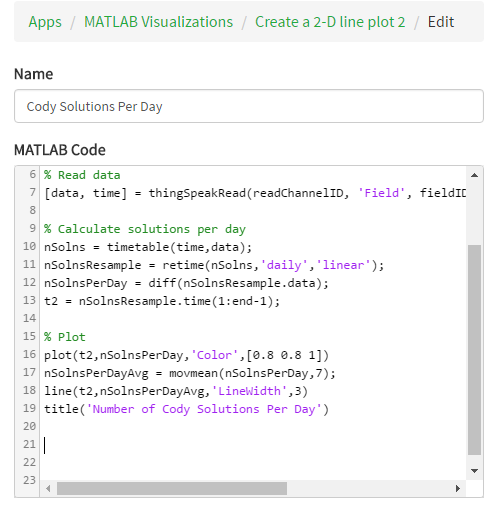
And finally, here is the plot I’ve been working toward.
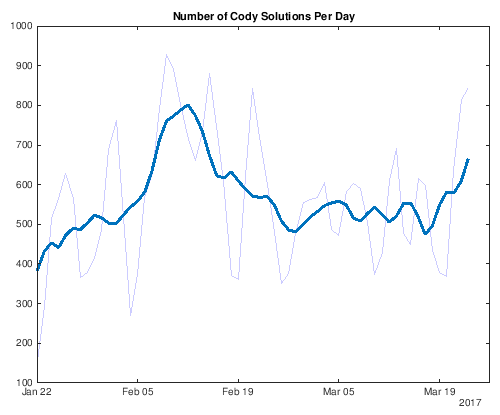
Every day we get between 400 and 900 new solutions on Cody. And now I can see that there was a marked rise in the number of solutions submitted in mid-February. I wonder why? That’s a question for another day. For now I want to close by pointing out that all this was free and based on the latest version of MATLAB. From now until the day I shut down this channel, I will have this automatically generated plot of up-to-date Cody statistics. Thanks ThingSpeak!




댓글
댓글을 남기려면 링크 를 클릭하여 MathWorks 계정에 로그인하거나 계정을 새로 만드십시오.