
Semi-Automated Testing
I've been doing a bit of spelunking around the File Exchange and GitHub lately, and I've seen a little pattern emerge in the tests of surprisingly many projects. It looks like this:
classdef testDisk < matlab.unittest.TestCase

    properties
        map
    end

    methods (TestClassSetup)
        function createMap(testCase)
            opt = sctool.scmapopt('trace',0,'tol',1e-12);
            p = polygon([4 2i -2+4i -3 -3-1i 2-2i]);
            testCase.map = diskmap(p,opt);
        end
    end

    methods (Test)

        function testPlot(testCase)
            fig = figure;
            plot(testCase.map,4,3) % <======= RIGHT HERE!
            close(fig);
        end

    end

end
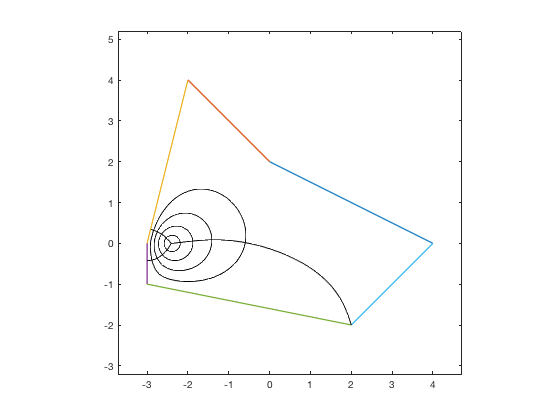
The plot command shows and exercises the graphical features of this toolbox. If we just run this outside of test form we can see it produces a cool result.
opt = sctool.scmapopt('trace',0,'tol',1e-12);
p = polygon([4 2i -2+4i -3 -3-1i 2-2i]);
map = diskmap(p,opt);
fig = figure;
plot(map,4,3)
By the way, in this case I am pulling from the Schwarz-Christoffel Toolbox, which by my eye looks to be quite a nice package! Check out the User's Guide.
The idea here is great, right? The developer of the project is looking to get coverage on one of the key capabilities of the package, the visualization. At a minimum, the test is indeed confirming that the plot code executes without error, which is a great step. However, I feel like this might speak to a common pain point. How do I verify things that are very hard to verify, like graphics? Before we throw our hands into the air and flip over any tables its worth noting that we may have a few options. We certainly can get access to the data in the plot and numerically confirm that it is plotted as expected. We can also check the properties of the graphics primitives and so on and so forth. This is all true, but I think it risks missing the point. Sometimes you just want to look at the dang plot!
You might know exactly when the plot is right and when it is wrong. You might see subtle visual problems right away looking at it that would take forever to try to encode in a test covering every single property of every single graphics primitive you are working with.
Just let me look at the plot.
This test does just that, but it flashes the figure up on the screen and you have to look very closely (and quickly) or use a debugging workflow to get real insight and confirm the visualization is working correctly. A worse alternative is just to leave figures open and never close them. This litters your MATLAB environment every time you run the tests and is really hard to determine how each figure was produced and for what test. It doesn't work in a CI system workflow. In short, it makes it hard to verify the plots are correct, which means that we won't verify the plots are correct.
Know what we can do though? We can log! We can testCase.log! We've already gone through the hard work of creating these figures and visualizations. Why don't we log them and see them later? We can do that pretty easily because we have a FigureDiagnostic class that takes a figure handle and saves it away as both a .fig file and a .png file. That way we can log it away and open it up after the test run. If we were verifying anything (like the plot data or graphics attributes) we could also just use these diagnostics as the diagnostics input on the verification or assertion methods we are using. For the test above, let's log it:
classdef testDisk < matlab.unittest.TestCase

    properties
        map
    end


    methods (TestClassSetup)
        function createMap(testCase)
            opt = sctool.scmapopt('trace',0,'tol',1e-12);
            p = polygon([4 2i -2+4i -3 -3-1i 2-2i]);
            testCase.map = diskmap(p,opt);
        end
    end


    methods (Test)

        function testPlot(testCase)
            import matlab.unittest.diagnostics.Diagnostic;
            import matlab.unittest.diagnostics.FigureDiagnostic;

            fig = figure;
            % Let's use addTeardown instead because https://blogs.mathworks.com/developer/2015/07/27/addteardown/
            testCase.addTeardown(@close, fig);
            plot(testCase.map,4,3);

            % Now we log it for fun and for profit.
            testCase.log(3, ...
                Diagnostic.join('Please confirm there are concentric convex sets in the lower left.', ...
                FigureDiagnostic(fig)));

        end

    end

end
I've put a nice description on there so we know what we are looking for in the figure. I did this by joining a string description with our FigureDiagnostic using Diagnostic.join. Also, I've logged it at level 3, which corresponds to the Detailed level of the Verbosity enumeration. This means it won't show up if I just run the standard runtests call:
runtests('tests/testDisk.m')
Running testDisk
....
Done testDisk
__________


ans =

  1×4 TestResult array with properties:

    Name
    Passed
    Failed
    Incomplete
    Duration
    Details

Totals:
   4 Passed, 0 Failed, 0 Incomplete.
   0.80408 seconds testing time.
...but it will if I run at a higher level of logging:
runtests('tests/testDisk.m','Verbosity','Detailed')
 Running testDisk
  Setting up testDisk
  Done setting up testDisk in 0.01131 seconds
   Running testDisk/testForwardMap
   Done testDisk/testForwardMap in 0.0076177 seconds
   Running testDisk/testInverseMap
   Done testDisk/testInverseMap in 0.0071096 seconds
   Running testDisk/testCenter
   Done testDisk/testCenter in 0.0082754 seconds
   Running testDisk/testPlot
[Detailed] Diagnostic logged (2018-07-30T15:42:18):
Please confirm there are concentric convex sets in the lower left.
Figure saved to:
--> /private/var/folders/bm/6qgg87js1bb7fpr2p475bcwh0002wp/T/094eb448-615a-4667-95e2-0a6b62b81eae/Figure_2d16d47d-a44a-4425-9507-84bb27afcf26.fig
--> /private/var/folders/bm/6qgg87js1bb7fpr2p475bcwh0002wp/T/094eb448-615a-4667-95e2-0a6b62b81eae/Figure_2d16d47d-a44a-4425-9507-84bb27afcf26.png

   Done testDisk/testPlot in 1.3447 seconds
  Tearing down testDisk
  Done tearing down testDisk in 0 seconds
 Done testDisk in 1.379 seconds
__________


ans =

  1×4 TestResult array with properties:

    Name
    Passed
    Failed
    Incomplete
    Duration
    Details

Totals:
   4 Passed, 0 Failed, 0 Incomplete.
   1.379 seconds testing time.
Great! Now we can see links in the test log pointing to images of the plot as well as a figure file. This is nice, but I am just getting started. Let's see this workflow when we generate a test report:
import matlab.unittest.plugins.TestReportPlugin;

runner = matlab.unittest.TestRunner.withTextOutput;
runner.addPlugin(TestReportPlugin.producingHTML('Verbosity',3))
runner.run(testsuite('tests'))
Running testAnnulus

Number of iterations: 32
Number of function evaluations: 91
Final norm(F(x)): 1.27486e-09
Number of restarts for secant methods: 1
...
Done testAnnulus
__________

Running testDisk
....
Done testDisk
__________

Running testExterior
...
Done testExterior
__________

Running testHalfplane
...
Done testHalfplane
__________

Running testRectangle
...
Done testRectangle
__________

Running testStrip
...
Done testStrip
__________

Generating report. Please wait.
    Preparing content for the report.
    Adding content to the report.
    Writing report to file.
Report has been saved to: /private/var/folders/bm/6qgg87js1bb7fpr2p475bcwh0002wp/T/tp86d8e3a7_aedb_45fa_a82e_0ceb6430ee87/index.html

ans =

  1×19 TestResult array with properties:

    Name
    Passed
    Failed
    Incomplete
    Duration
    Details

Totals:
   19 Passed, 0 Failed, 0 Incomplete.
   8.7504 seconds testing time.
This is where it really starts to get beautiful. Now we have a full report that we can view at our leisure and confirm that all the visualizations are correct
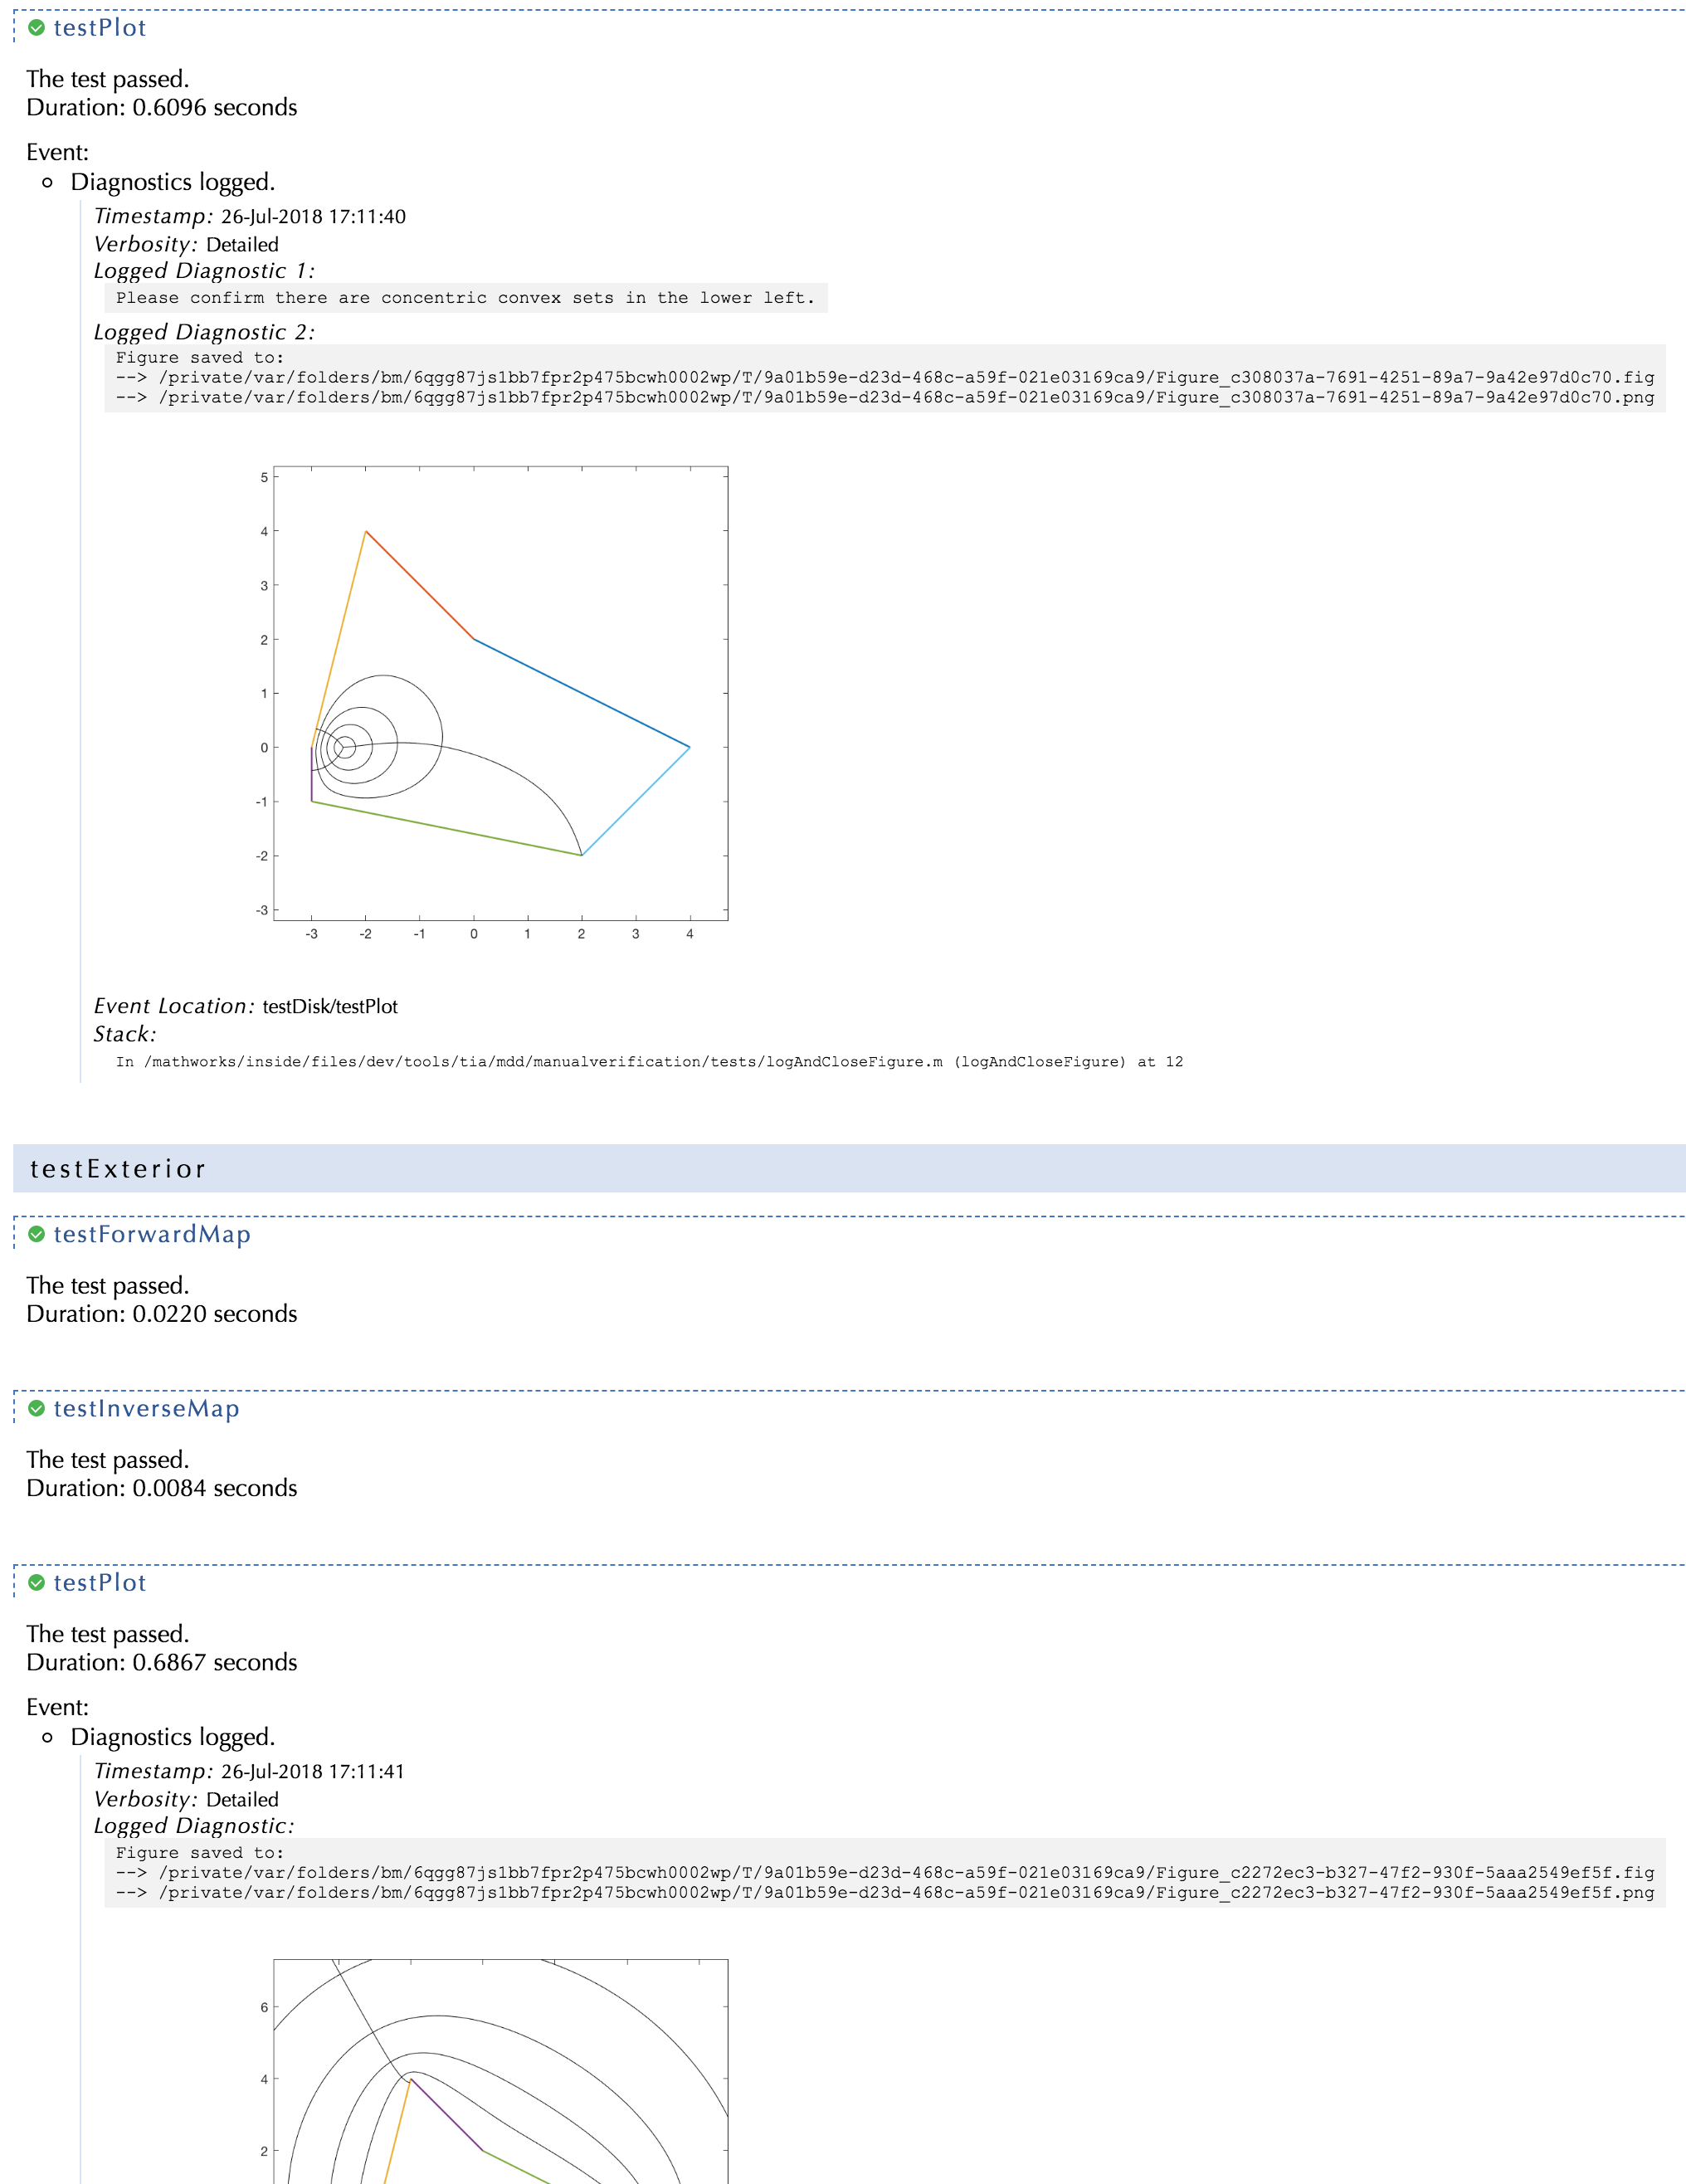
We've run the whole test suite and have captured the figures for all the tests not just this one. We are now in the realm of semi-automated testing. There are some things that really need a human to take a look at to confirm correctness. However, the entirety of the test run and test setup can still be automated! This can still be done via a CI system so you don't have to remember to run the tests and look over the plots every time you change the code. You simply let the automation do it. For things that need manual verification you can always log away the artifacts in a pdf or html report and confirm periodically, or prior to release. If there is a bug, you can mine the artifacts from all your CI builds to see where and when it was introduced.
You can even extend this approach to add an expected image to the report. So if you log a known good expected image and then use the test code to generate the image for each software change you can look at the actual image and the expected image right next to each other and confirm that they match. Beautiful. Full test automation is clearly the ideal to strive for, but in those cases that you really need to look at a picture, let the framework and your CI system do all the work for you in setting it up and you can just quickly and efficiently verify that it is correct.
Happy semi-automated testing!
P.S. Take a look at the full report generated in PDF form here
- Category:
- Testing


Comments
To leave a comment, please click here to sign in to your MathWorks Account or create a new one.