
Build a RAG Pipeline in MATLAB: From Document Ingestion to LLM-Driven Insights
The following post is from Yuchen Dong, Senior Finance Application Engineer at MathWorks.
The example featured in the blog can be found on GitHub here.
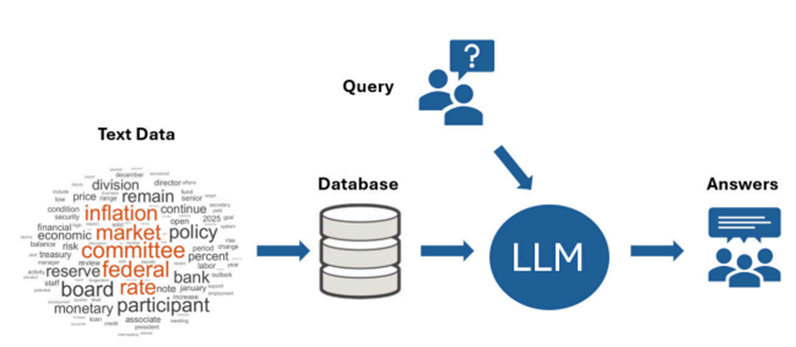
Retrieval-Augmented Generation (RAG) has emerged as a powerful architecture to ground large language models (LLMs) in trusted, domain-specific data. In finance, pairing LLMs with curated sources, such as Federal Open Market Committee (FOMC) minutes, can drive more reliable insight generation.
In this blog, we’ll walk through how to build a RAG pipeline using MATLAB, from preprocessing FOMC documents all the way to generating responses with LLMs of your choice. You can tailor the database with hundreds of diverse, finance-related documents to suit your specific needs.
Why It Matters
With just a few lines of code, you can:
- Store vectorized insights from regulatory reports
- Search them efficiently using semantic similarity
- Provide LLM responses anchored in real-world financial data
This RAG architecture is a powerful tool for compliance analysts, economists, and financial engineers seeking to extract value from unstructured documents.
Step 1: Load Meeting Documents
To begin, we load a document that reflects real-world financial discourse: minutes from a Federal Open Market Committee (FOMC) meeting, where U.S. monetary policy decisions are made. In this example, we use a single FOMC document in .pdf format.

Step 2: Preprocess the text
Raw text data is often messy. It may include stop words, punctuation, and inconsistent word forms that can reduce the accuracy of downstream tasks like embedding and search. To prepare our FOMC meeting notes for analysis, we use the Preprocess Text Data live task in MATLAB to clean and normalize the content.
This step includes tokenization, lemmatization, and removal of stop words and punctuation. The result is a cleaner, more structured text suitable for vectorization.
To visualize what terms dominate the discussion, we generate a word cloud of the preprocessed content:


This highlights dominant themes, such as inflation, policy rates, and employment.
Step 3: Chunking the Text
Before embedding the text, we apply two key steps:
- Filter out short fragments that contain fewer than three tokens—these often represent incomplete or uninformative sentences.
- Split the cleaned document into fixed-size chunks (in this case, ~128 tokens each), ensuring the resulting segments are manageable for vectorization and LLM input limits.


Step 4: Vectorize the Document Chunks
This model requires the Text Analytics Toolbox Model for either the all-MiniLM-L6-v2 Network or all-MiniLM-L12-v2 Network support package.

If the support package is not installed, it can be downloaded from the Add-Ons Menu.

With our text chunks ready, we now convert them into numerical vectors using a pretrained embedding model. These embeddings form the semantic backbone of our Retrieval-Augmented Generation (RAG) system.

Step 5: Store Embeddings in a Vector Database
To support fast and accurate retrieval for RAG workflows, we store the document embeddings in a vector database: specifically, PostgreSQL with the pgvector extension.
The pgvector extension enables you to store and query high-dimensional embedding vectors directly within PostgreSQL, along with any related structured data. This streamlines your architecture by combining traditional relational data and semantic search into one system.
Once pgvector is installed, you can use the Database Explorer App in MATLAB to connect to your PostgreSQL instance and view or query the embedded vectors—such as those we generated from the FOMC meeting notes.
Step 6: Retrieve Documents Based on a Query
Suppose we want to ask:
“Will the Federal Funds rate decrease in the next 3 months?”
The results are the most semantically relevant document snippets related to the query.

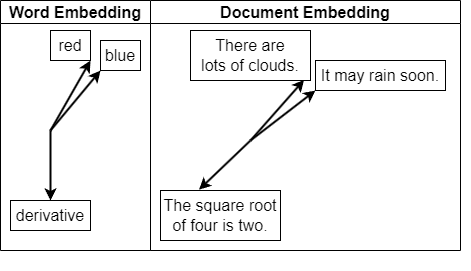
Step 7: Visualize and Validate Similarity
To evaluate the results, we compute cosine similarity and plot a t-SNE map to show how close the query is to the returned documents in vector space.

Step 8: Ask the LLM to Generate a Response
With the top matching chunks, we construct a prompt and generate a grounded answer using an LLM. The output provides a detailed response supported by FOMC context—grounded, explainable, and tailored to financial analysis.

The example featured in the blog can be found on GitHub here.
Reference
[1] Large Language Models with MATLAB: https://www.mathworks.com/matlabcentral/fileexchange/163796- large-language-models-llms-with-matlab
[2] Information Retrieval with Document Embeddings: http://mathworks.com/help/textanalytics/ug/information-retrieval-with-document-embeddings.html
[3] Board of Governors of the Federal Reserve System: https://www.federalreserve.gov/monetarypolicy/ fomccalendars.htm
- Category:
- Artificial Intelligence


Comments
To leave a comment, please click here to sign in to your MathWorks Account or create a new one.