
Run Dynare at Scale on Databricks with Interactive MATLAB
 |
Expert Contributor: Dr. Eduard Benet Cerdà
Edu is a Senior Application Engineer at MathWorks advising customers in the development and deployment of financial applications. His focus areas are large scale applications leveraging cloud technologies for data storage, computational speed, or production and development environments, as well as the development and distribution of macroeconomic models. Eduard joined MathWorks in 2018 after finishing a PhD at the University of Colorado in computational mechanics. |
Dynare is a go-to framework for dynamic stochastic general equilibrium (DSGE) and macro-finance modeling.
This post walks through a practical workflow to:
- Build a custom Databricks compute resource to run MATLAB and Dynare
- Develop a Dynare model sourcing the data from Databricks
- Schedule and run that model as a Databricks job or pipeline
Why it matters: This workflow gives you a consistent, version‑locked MATLAB environment, flexible Dynare configuration, and orchestration for routine or large‑scale model execution.
What You’ll Build
With a few configuration files and scripts, you will:
- Launch Databricks compute using your own Docker image via Databricks Container Services
- Run MATLAB through your web browser with access to Unity Catalog for debugging and exploration
- Submit a Dynare job as a non-interactive batch run that writes outputs to a durable location and interactively displays them in a notebook
Step 0 — Prerequisites
- A Databricks workspace
- A container registry to host your image (ideally on the same region as your Databricks workspace)
- The MATLAB-Databricks support package
A license manager accessible from Databricks with access to R2022b or newer (R2026a recommended)
Step 1 — Build a custom Databricks image to run MATLAB and Dynare
The MathWorks reference architecture provides a Dockerfile to get a full MATLAB desktop running on Databricks. You can use it as-is or customize it, but ultimately, you must build an image that starts from a Databricks base image and adds MATLAB and its toolboxes.
Example build using Azure Container Registry:
 az acr build \
  --registry <registry> \
  --image databricks/matlab:R2026a-17.4 \
  --build-arg MATLAB_PRODUCT_LIST="MATLAB_Compiler_SDK Database_Toolbox Econometrics_Toolbox" \
  --build-arg INCLUDE_JRE=0 \
  --build-arg LICENSE_SERVER=<licenseServer> \
  --file resources/dockerfiles/matlab/Dockerfile \
  https://github.com/mathworks-ref-arch/matlab-on-databricks.git
Consider keeping Dynare outside the container. Instead, add only optional libraries (e.g., to run TeX) tht some workflows migh require. This lets you test different Dynare versions without rebuilding the container.
Once the image is ready, the next step is to start with a compute resource. Databricks Container Services lets you specify a Docker image when you create compute. From the UI, you can see this in “Create Compute > Advanced > Docker” fig 1
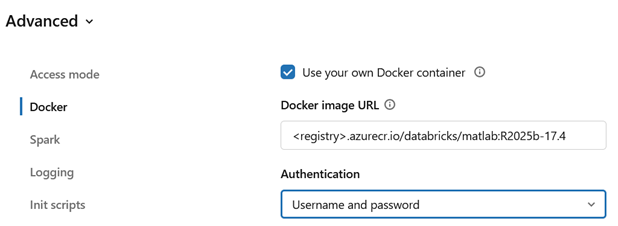
However, configuring these settings through the UI can be tedious and error‑prone. Two approaches work better in practice:
(A) Use a Databricks Policy
This is the recommended approach. A Databricks admin can create a policy that pins the MATLAB version, grant Unity Catalog access, and allow controlled user choices (e.g. instance size and idle timeout). Anyone with access can go into the portal and start a cluster.
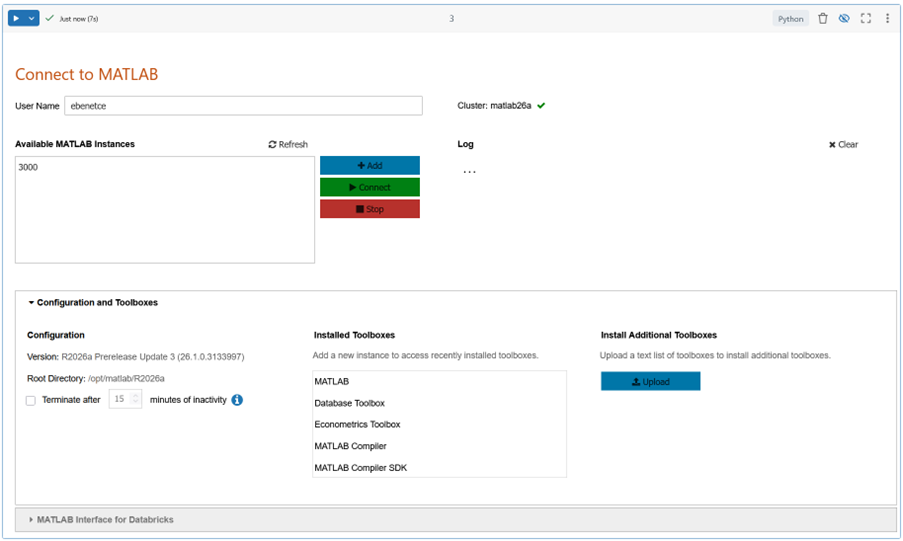
To start a MATLAB session, launch it from a notebook, which serves as the entry point in Databricks. The notebook in Fig. 2 (Dockerfiles, available in the same GitHub repository as the Dockerfiles) starts MATLAB sessions, adds toolboxes at runtime, and configures the environment.
(B) Use the REST API
You can also create, start, and stop a cluster using the Databricks REST API. MATLAB Interface for Databricks includes a function that creates a cluster and returns the URL of the running MATLAB instance.
cdt = createMATLABDesktopCluster( ...
        dockerAuthFile    = 'credentials.json', ...
        name              = "matlab26a");
The notebook in Fig. 2 can also manage sessions.
Consider including MATLAB Interface for Databricks in the environment. If it is not included in the Dockerfile, both the notebook and the function above will install it from Unity Catalog.
Step 2 — Develop a custom Dynare model sourcing the data from Databricks
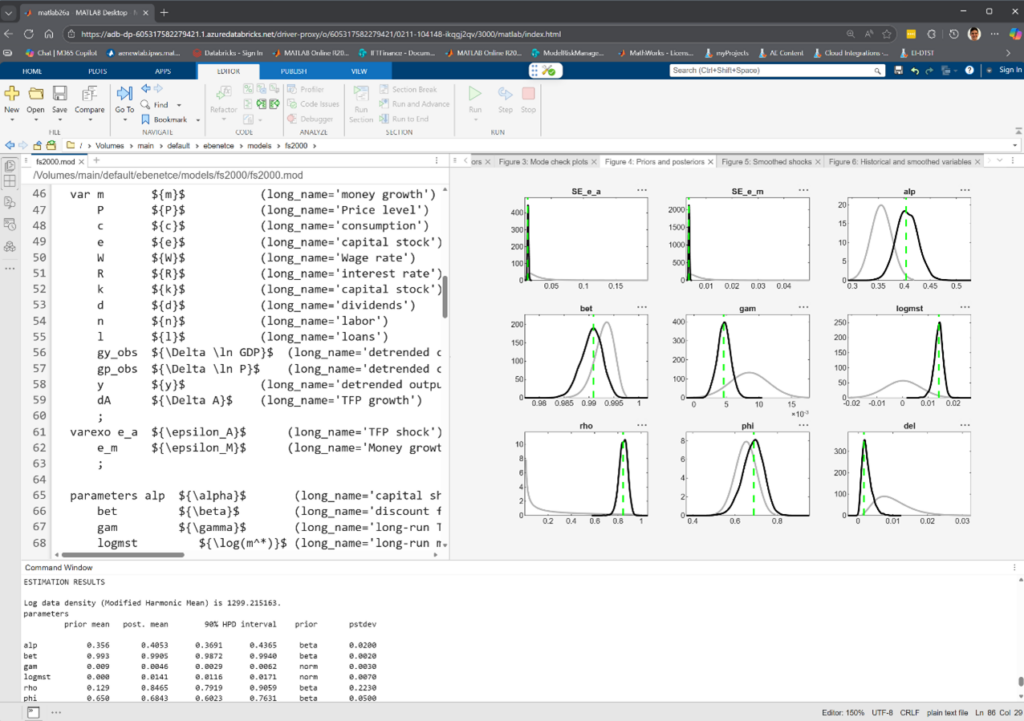
With MATLAB running inside Databricks (Figure 3) and MATLAB Interface for Databricks active, you can develop your Dynare model as usualUnity Catalog (Fig 3). To develop our DSGE model, we only need Dynare itself. You can source it in different ways, but because the base image runs in Ubuntu 24.04, you can install the .mltbx package provided for use with MATLAB by the Dynare team:
>> websave('dynare.mltbx', 'https://www.dynare.org/release/matlab-online/dynare-6.5.mltbx');
>> matlab.addons.install('dynare.mltbx');
To showcase the Databricks interactions, this post uses a bundled Dynare example, (fs2000.mod) Frank Schorfheide (2000): “Loss function-based evaluation of DSGE models”. This model requires a datafile, entered via the estimation command below:
estimation(order=1, datafile=fs2000_data,
The example data is not big and could simply be read as a file from Unity Catalog:
readtable('/Volumes/../mydata.mat')".
However, to demonstrate Databricks integration, the data is sourced using Spark, function as shown in Fig. 4.
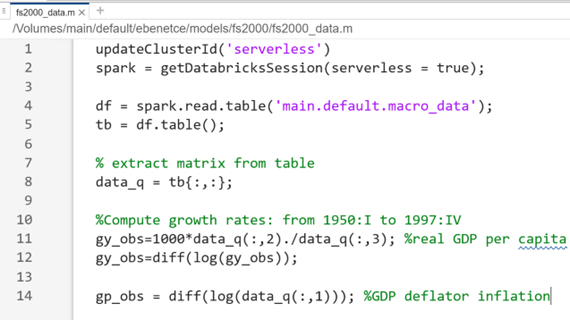
Our model is now fully integrated with Databricks and is simply run as any standard Dynare MOD file (see Fig 3 for sample output):
>> dynare fs2000.mod
Step 3— Schedule and run that model as a Databricks job or pipeline
To operationalize this model, start by placing the model assets in a Unity Catalog Volume using MATLAB Interface for Databricks:
>> f = databricks.Files
>> f.upload('fs2000_data.m', '/Volumes/main/default/models/fs2000/fs2000_data.m')
>> f.upload(‘fs2000.mod’, '/Volumes/main/default/models/fs2000/fs2000.mod')
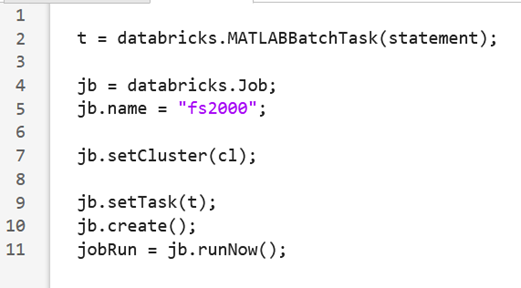
Next, I had to create a Databricks Job. For convenience, I used the MATLABBatchTask function from the support package. This function generates the Python notebook used to drive the job, supports pre‑ and postexecution Python steps for managing inputs and outputs, provisions the compute cluster, and runs the MATLAB workload end‑to‑end.
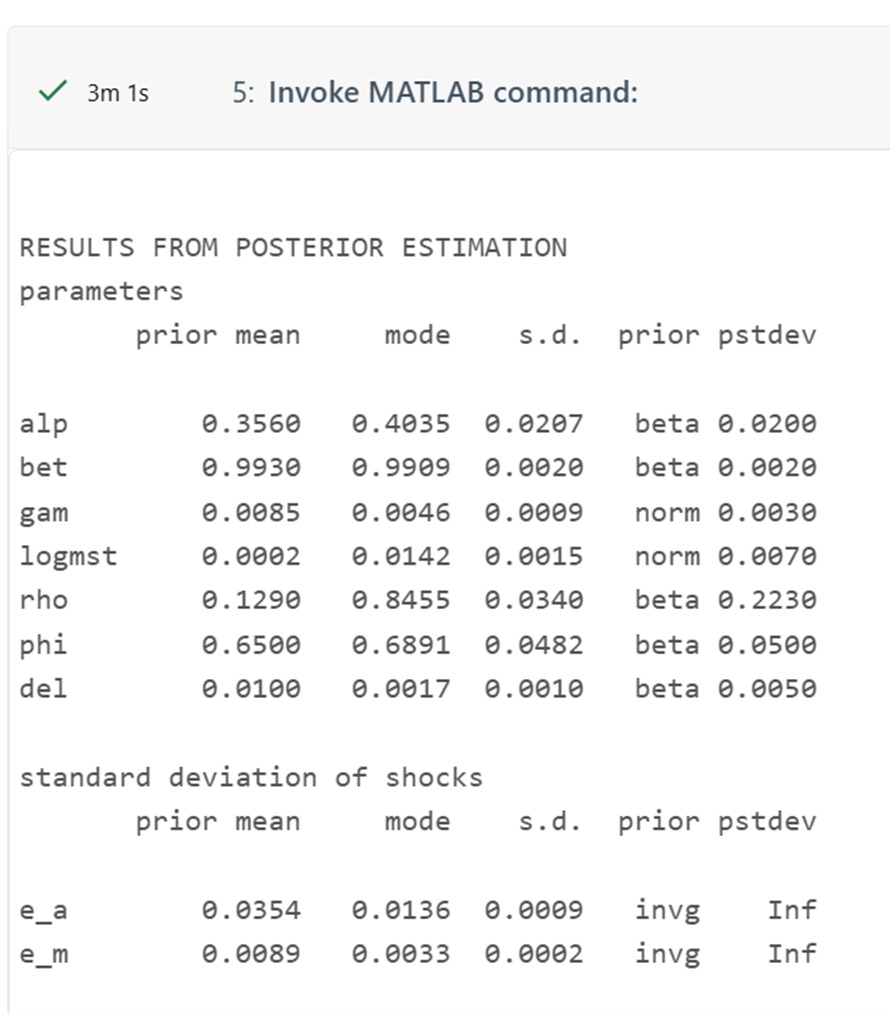
With a little customizations, the output notebook runs our Dynare model and displays the full output on screen:
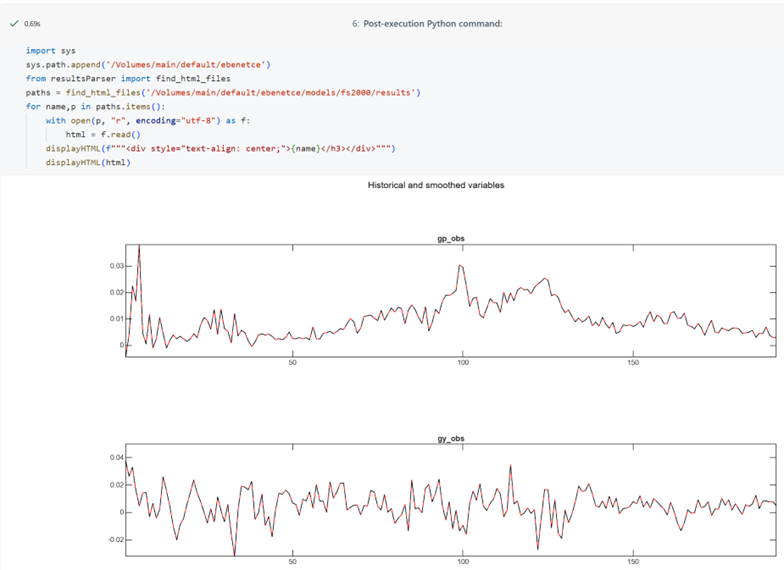
This example uses R2026a, a postexecution script that displays MATLAB figures directly inside the notebook. R2026a supports exporting plots as interactive HTML canvases—a format well suited to Databricks notebooks.
References
- Databricks: Customize containers with Databricks Container Service (custom Docker images on compute, requirements/limitations, CLI examples).
- MathWorks: MATLAB Container on Docker Hub (interactive browser and VNC modes, licensing notes).
- MathWorks: Databricks – MATLAB and Simulink / MATLAB Interface for Databricks (support package capabilities and workflows).


댓글
댓글을 남기려면 링크 를 클릭하여 MathWorks 계정에 로그인하거나 계정을 새로 만드십시오.