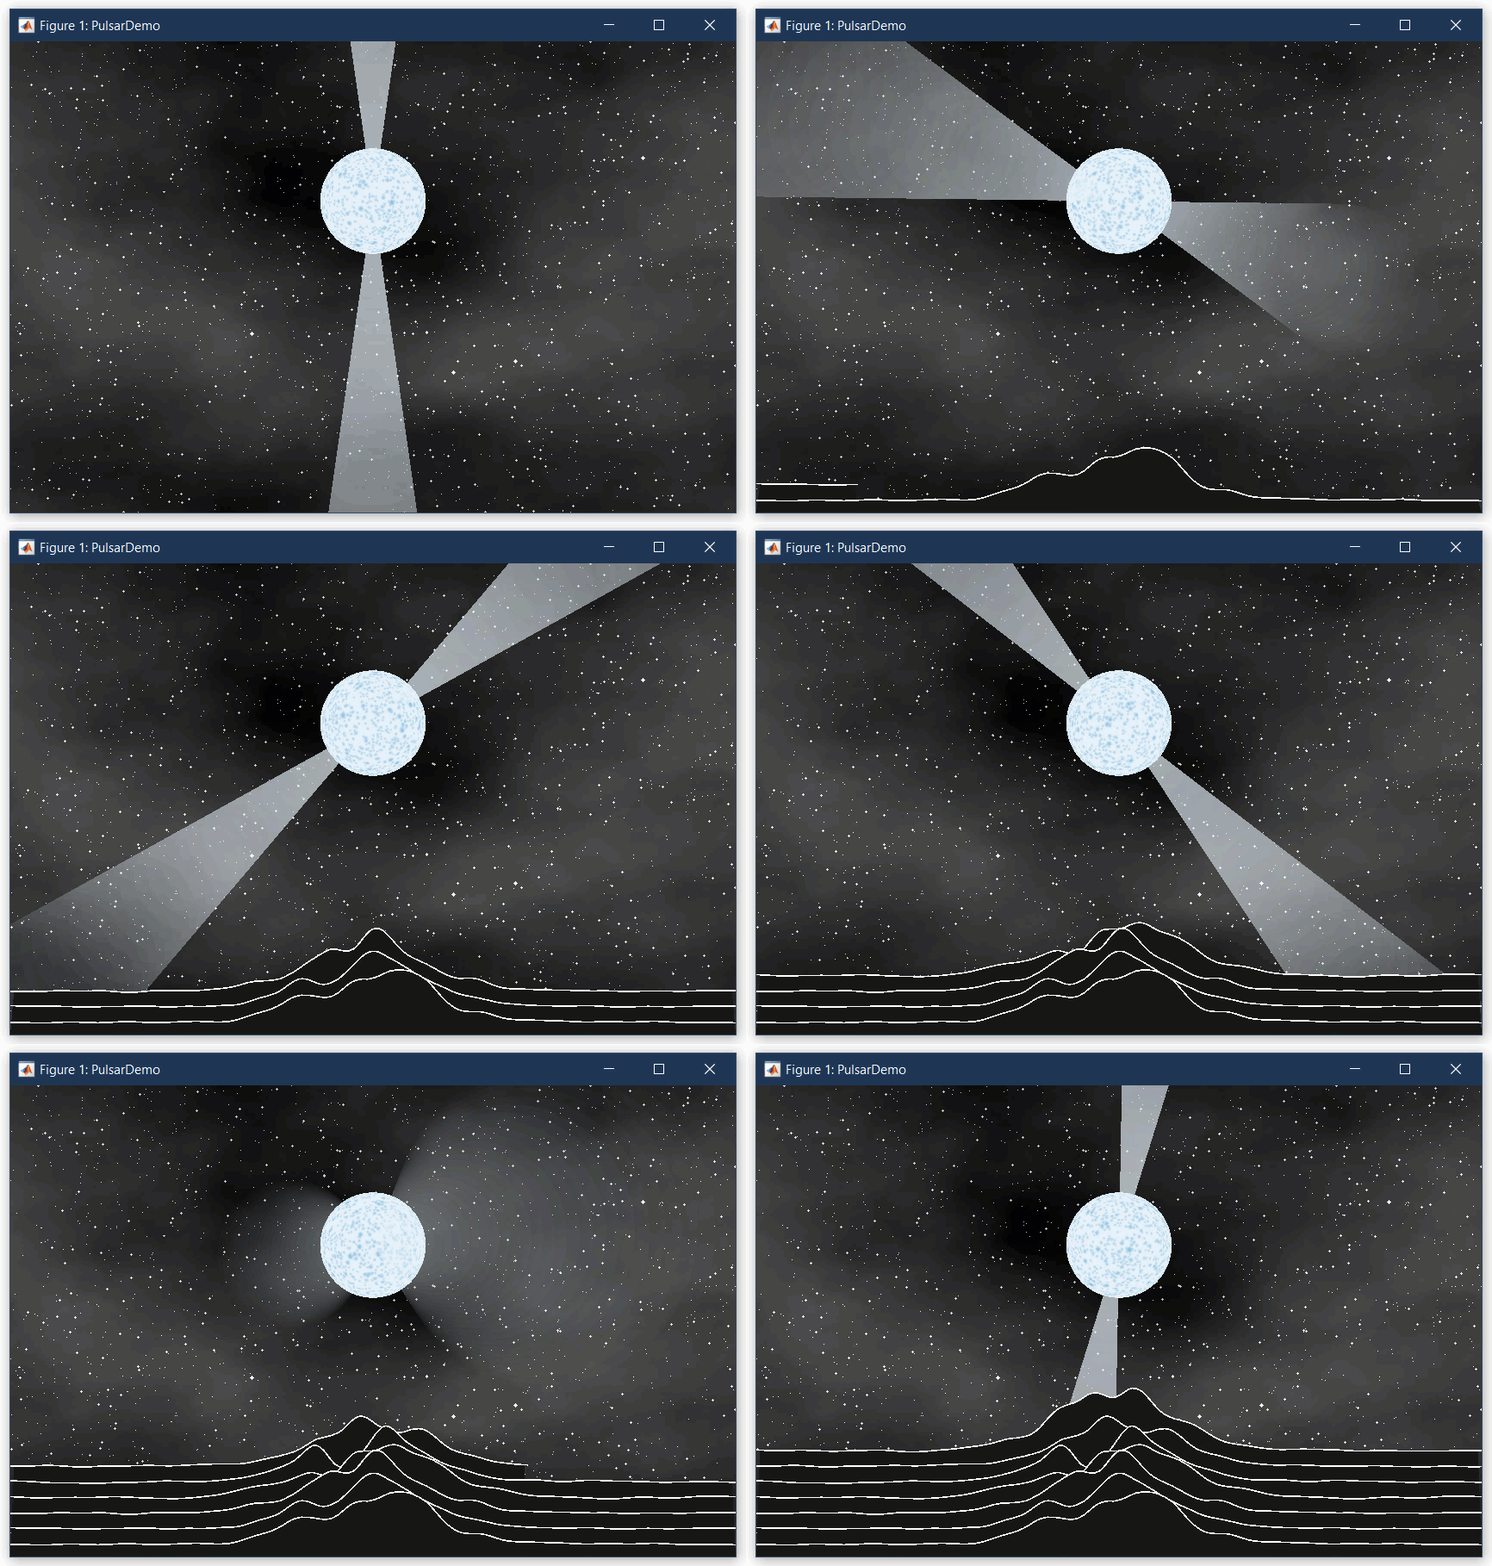
In 1979, an English rock band produced what Rolling Stone would describe as one of the best albums of all time with an album cover that would become iconic in data visualization. Joy Division's... 더 읽어보기 >>

In 1979, an English rock band produced what Rolling Stone would describe as one of the best albums of all time with an album cover that would become iconic in data visualization. Joy Division's... 더 읽어보기 >>

Welcome to the launch of the MATLAB Graphics and App Building blog! I am your host, Adam Danz, whom some readers may recognize from the MATLAB Central Community. My experience with MATLAB started as... 더 읽어보기 >>