
Visualizing yesterday’s earthquake in Boston using MATLAB and a Raspberry Shake
During an online meeting with my colleagues in Boston yesterday, some of them were rather startled when their offices started violently shaking for a brief time! We quickly hopped onto BlueSky (Feel free to follow me there) where we saw thousands of messages referring to what everyone suspected was an earthquake. We now know that it was indeed an earthquake that had a magnitude of 3.8 on the Richter scale.
Learning that MathWorks has a seismograph
"You know we have a seismograph at MathWorks right?" one of my colleagues asked me. Another colleague, Christopher Stapels, wrote about it in 2022 when he used it to study traffic passing by MathWorks' headquarters. The seismograph is a Raspberry Shake and is constantly sending data to the cloud.
Our shake has an ID of RF23B and you can visualize its location, along with all of the other shakes online in the world, at stationview.raspberryshake.org.
Now you know the ID of our device, you can download data from it as a miniSeed file. The API call below requests the data between 3pm and 4pm GMT on 27th January for the device RF23B and saves it as the file waveform.mseed.
urlQuery =...
"https://data.raspberryshake.org/fdsnws/dataselect/1/query?starttime=2025-01-27T15:00:00&endtime=2025-01-27T16:00:00&network=AM&station=RF23B";
websave("waveform.mseed",urlQuery);
Loading the seismograph data into MATLAB
In order to load the miniSeed file I made use of the RDMSEED and MKMSEED package, written by François Beauducel, on File Exchange. You'll need to install this before proceeding.
Once this is installed we can load and visualize the waveform.seed file we downloaded earlier
waveform = rdmseed('waveform.mseed','simple')
The t field of this structure represents time and is an array of numbers that records time relative to some point in the past. Here is the first one
waveform.t(1)
I'd prefer to have the times represented as datetime values so need to figure out how to convert them. There are a range of conversion possibilities available via the 'ConvertFrom' option of datetime. For example 'datenum' assumes everything is relative to 0-Jan-0000 while 'excel' assumes everything is relative to 0-Jan-1900. The correct offset is probably discussed in the documentation somewhere but I'm lazy and just guessed.
datetime(waveform.t(1),"ConvertFrom","datenum")
Looks right! I Let's plot
waveform.u = datetime(waveform.t,'ConvertFrom','datenum');
plot(waveform.u,waveform.d)
axis tight
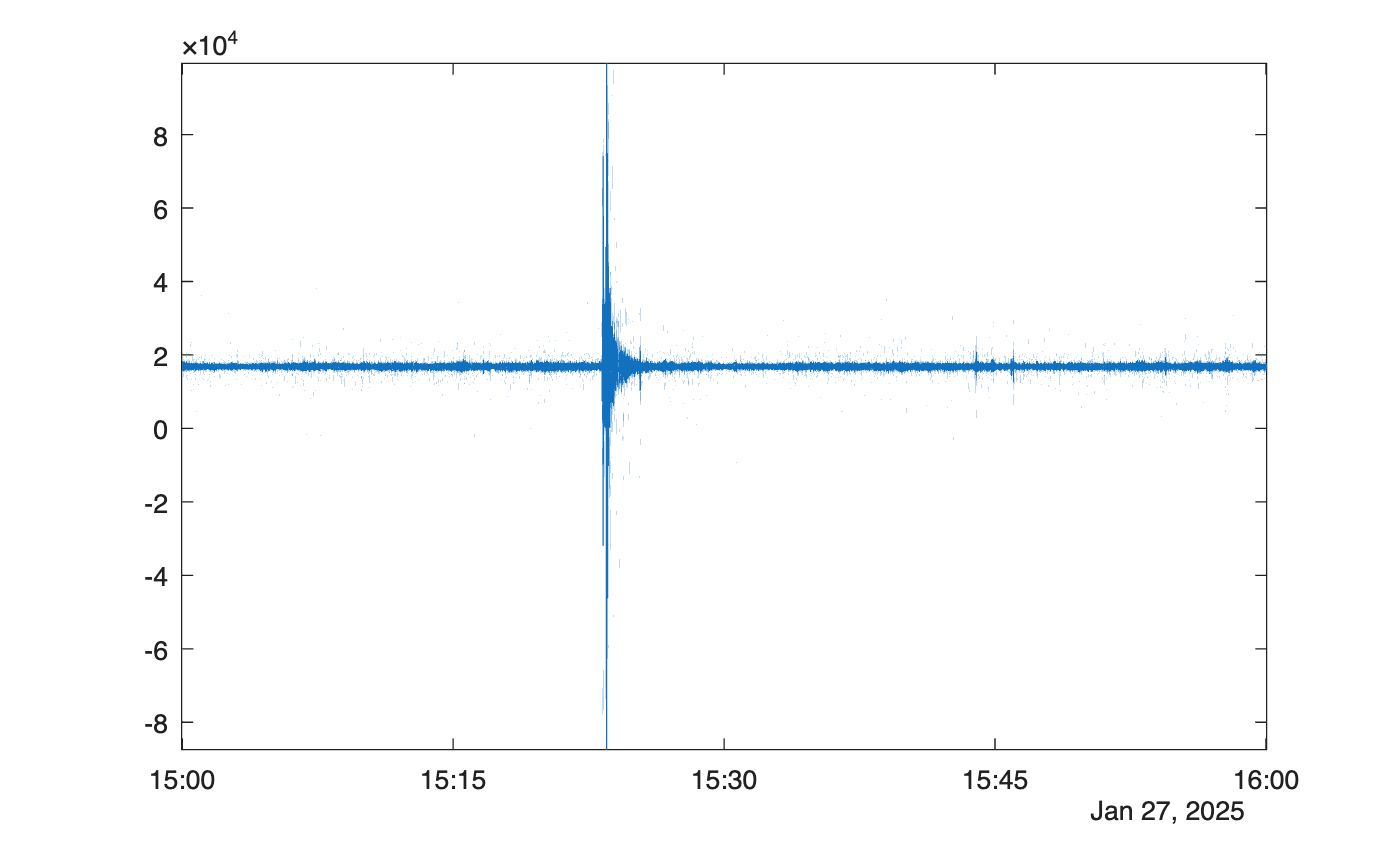
I'm not sure what the y-axis represents yet but I imagine this to be like a pen on an old-school seismograph until I learn better. Something big happened between 15:15 and 15:30, let's see when this was exactly by finding at what time the maximum amplitude occurred.
[maxD,Idx] = max(abs(waveform.d));
waveform.u(Idx)
Looking online, the earthquake is reported to have occurred eight miles underground near York Harbor at 15:22 GMT - a minute and a half from where I found the maximum amplitude. I know next to nothing about seismograph analysis and so even this discrepancy is confusing to me. Several things occur to me that might explain it but I'm not sure what the answer is.
I'm also wondering what else we could learn about the earthquake from this dataset. Do any of you have any insight here? Let me know in the comments section, or on via any of my social accounts below
- Category:
- Data Science,
- Fun,
- geoscience,
- Raspberry Pi


Comments
To leave a comment, please click here to sign in to your MathWorks Account or create a new one.