Image visualization using transparency
Transparent graphics objects can be used effectively to visualize image processing concepts. Two particularly useful techniques are:
- Highlighting image regions with transparent patches
- Displaying one image transparently over another
Today I'll show how to highlight image regions with patches. For this example I'll use the 'Extrema' measurement returned by regionprops. The extrema for a given object are eight points: the left-most pixel on the bottom, the right-most pixel on the bottom, the top-most pixel on the right, the bottom-most pixel on the right, and so on.
I'll start with the rice image, segmenting it using techniques I've shown before.
I = imread('rice.png');
imshow(I)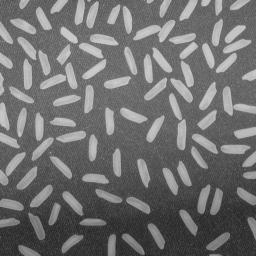
Even out the illumination with the tophat operator, threshold, and then clean up the thresholded image a bit.
I2 = imtophat(I, ones(15, 15));
bw = im2bw(I2, graythresh(I2));
bw2 = bwareaopen(bw, 5);
bw3 = imclearborder(bw2);
imshow(bw3)
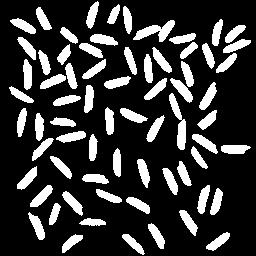
Label the binary objects and compute the extrema.
L = bwlabel(bw3);
s = regionprops(L, 'Extrema');
Each object has 8 extrema points associated with it.
s(1).Extrema
ans =

   11.5000   86.5000
   12.5000   86.5000
   34.5000  100.5000
   34.5000  102.5000
   33.5000  103.5000
   27.5000  103.5000
    9.5000   89.5000
    9.5000   87.5000
We can superimpose the extrema-bounded shapes on top of the original rice image by using patch objects.
imshow(I)

hold on
for k = 1:numel(s)
    x = s(k).Extrema(:,1);
    y = s(k).Extrema(:,2);
    patch(x, y, 'g')
end
hold off
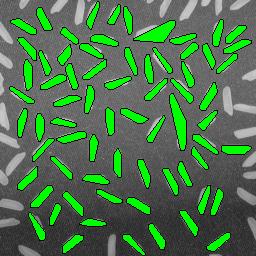
The above visualization is pretty clear. If you zoom in on some of the odd, larger shapes, though, you can't really tell what's going on.
axis([120 200 1 75])
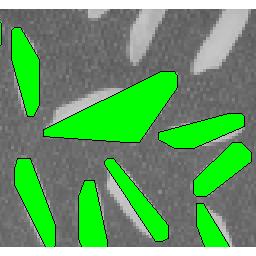
We solve that by displaying the patches transparently.
imshow(I)

hold on
for k = 1:numel(s)
    x = s(k).Extrema(:,1);
    y = s(k).Extrema(:,2);
    patch(x, y, 'g', 'FaceAlpha', 0.3)
end
hold off
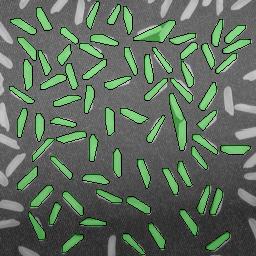
Now if you zoom in on the same region, we can see exactly what caused the unusual region.
axis([120 200 1 75])
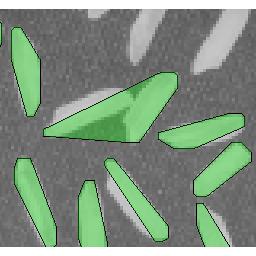
Two of the rice grains were touching.
Next time I'll show a couple of techniques for visualizing one image transparently superimposed on another.




コメント
コメントを残すには、ここ をクリックして MathWorks アカウントにサインインするか新しい MathWorks アカウントを作成します。