
MATLAB image display – autoscaling values with imshow
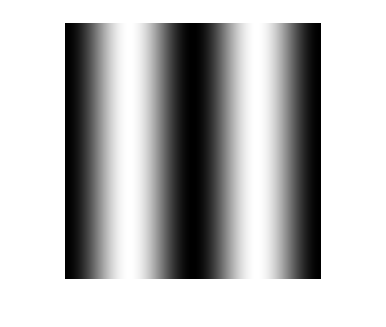
Last week I talked about displaying gray-scale and binary images. In that post, I showed how to control the grayscale range. For example, the call imshow(I,[0.4 0.6]) displays the matrix I as a gray-scale image so that the value 0.4 gets displayed as black, and the value 0.6 gets displayed as white.
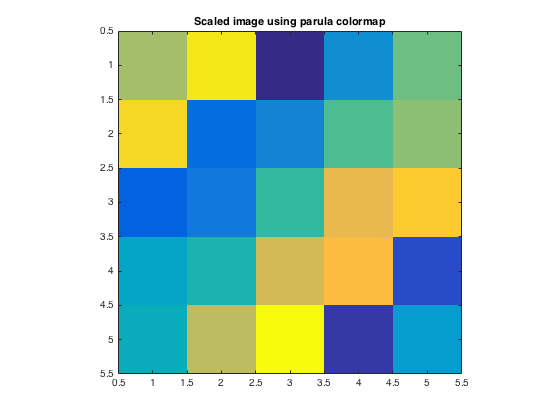
Brett, a MathWorks application engineer and frequent File Exchange contributor, correctly pointed out that I neglected to discuss a common and useful syntax: imshow(I,[]). This syntax automatically determines the grayscale range of the display based on the minimum and maximum values of I. It is equivalent to imshow(I,[min(I(:)) max(I(:))]).
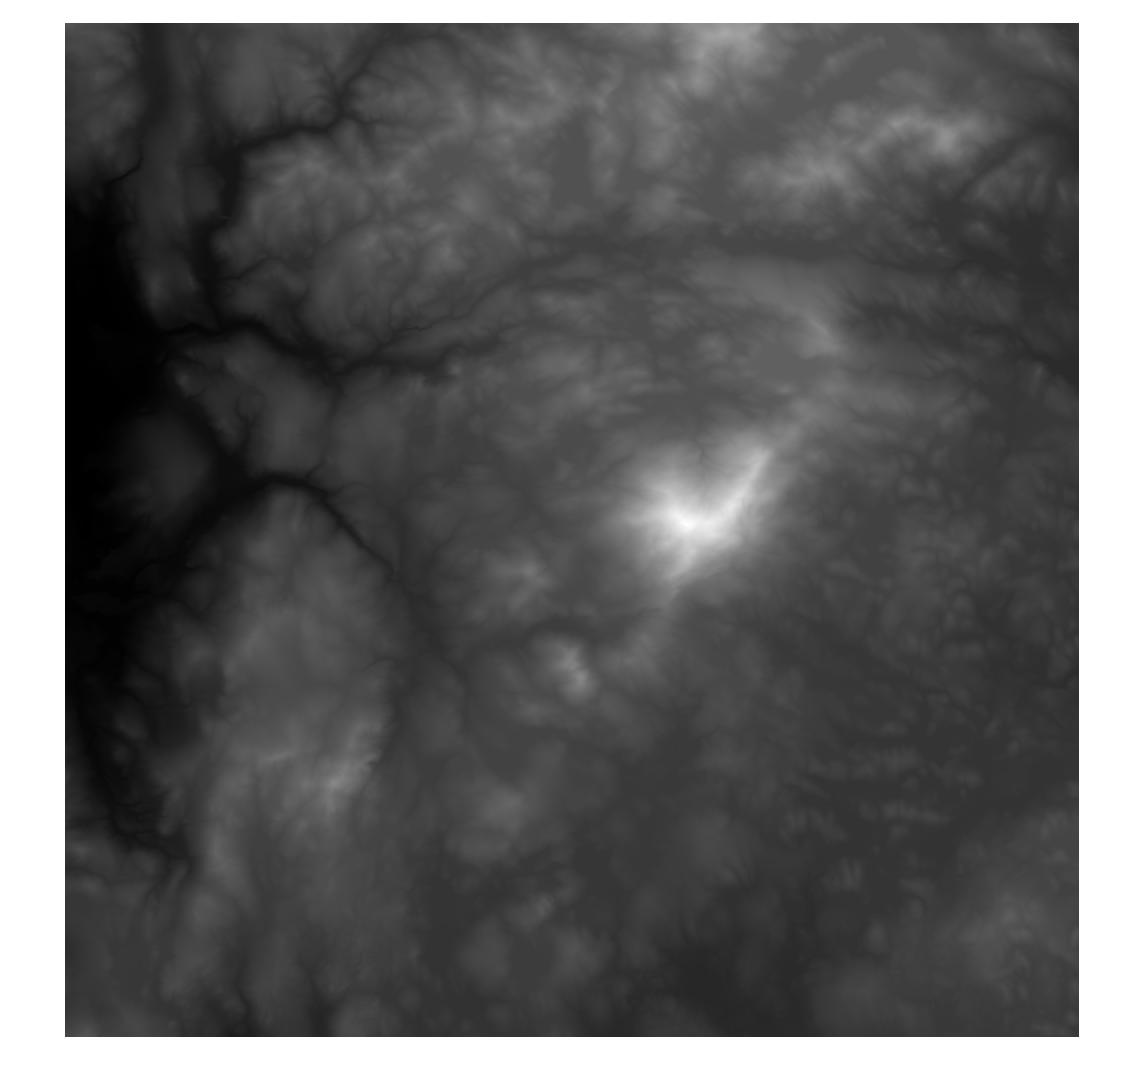
Here's an example. I have a matrix of terrain elevation values, in meters, near Mt. Monadnock in New Hampshire, USA. The peak of Mt. Monadnock is about 960 meters.
load mt_monadnock
The matrix is stored in the MAT-file using the variable name Zc.
whos Zc
  Name         Size                 Bytes  Class     Attributes

  Zc        3042x3042            37015056  single
min(Zc(:))
ans =

  141.5285
max(Zc(:))
ans =

  963.1366
To display these elevation values as a gray-scale image with autoscaling, just call imshow(Zc,[]):
imshow(Zc,[])
Warning: Image is too big to fit on screen; displaying at 33%
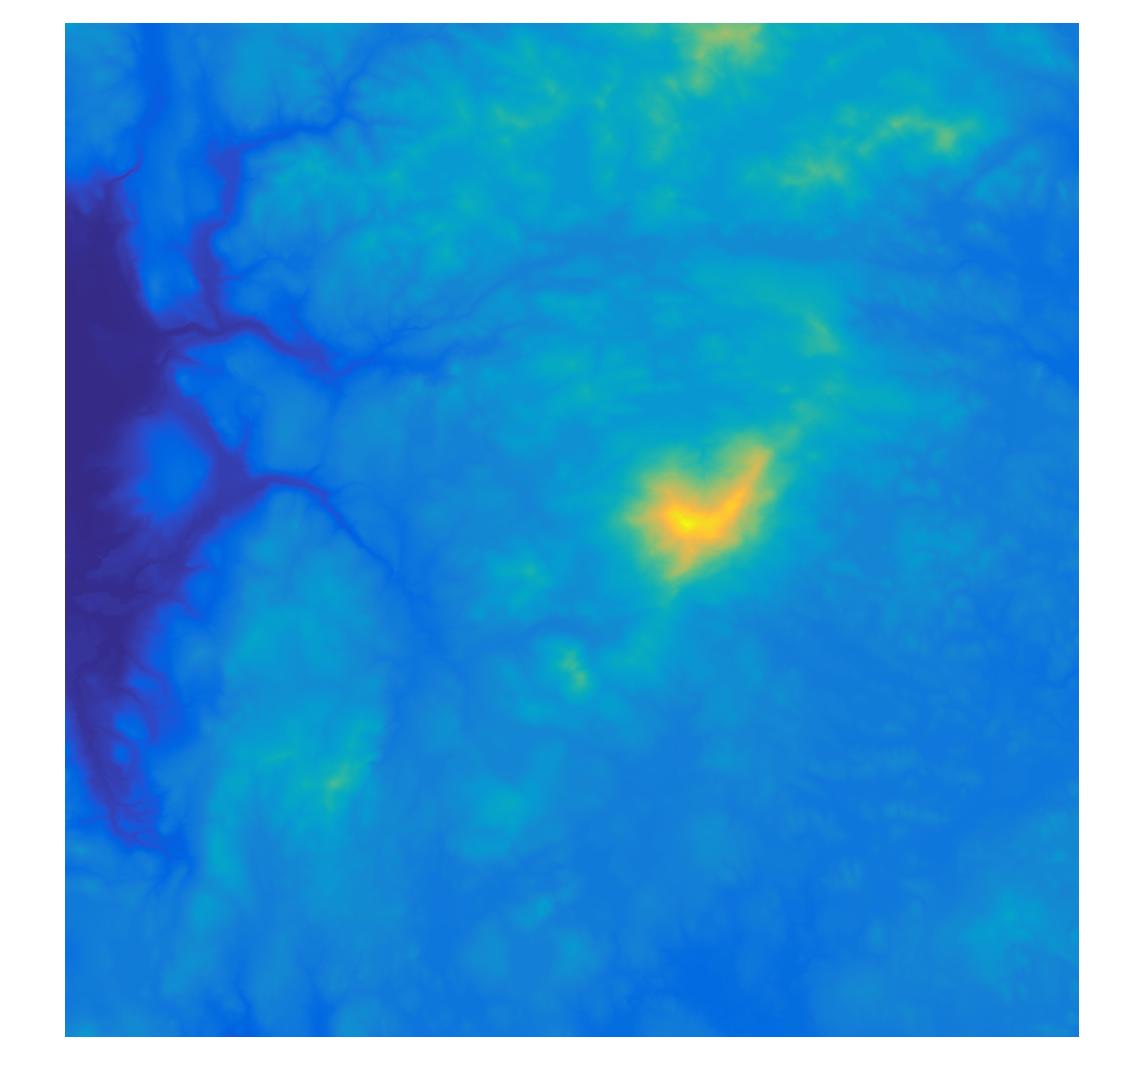
And, while we're here, I'll point out that you can install any colormap you like once a gray-scale image is displayed. Want some color?
colormap(parula)
- 범주:
- Pixel colors


댓글
댓글을 남기려면 링크 를 클릭하여 MathWorks 계정에 로그인하거나 계정을 새로 만드십시오.