
Visualizing the number of blocks in a Simulink model?
I was recently discussing different ways to visualize the content of a Simulink model with colleagues. Working in technical support, I receive models from users every day and it's always useful to quickly get a feeling of "what's in that model?".
At some point during the discussion, my colleague Reid Spence said "This would probably be useful to visualize the number of blocks in different subsystems using something like a Sankey diagram".
I thought that idea had potential, so I decided to give it a try.
Chart Examples
When I need a fancy type of visualization that does not ship with MATLAB, I usually begin my search with MATLAB File Exchange. In this case, my search led me to Chart Examples by my colleague Ken Deeley. Based on the image on File Exchange, I think this will do what I need!
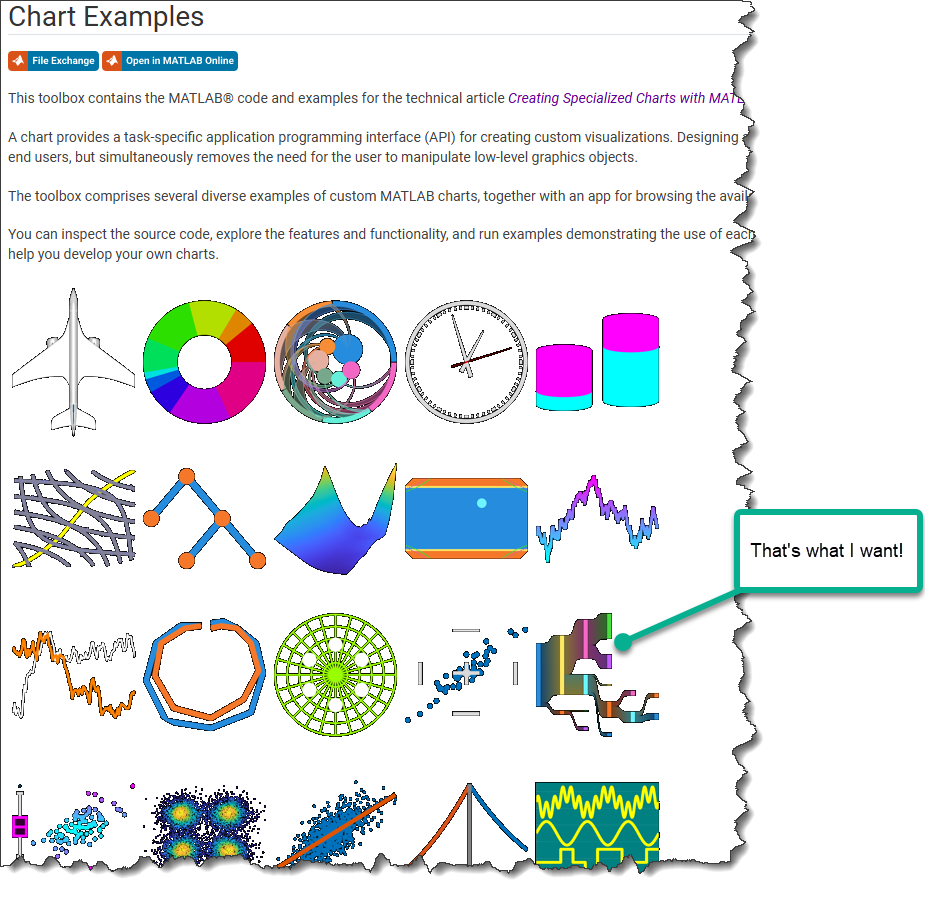
Looking at the examples included, I could quickly see that:
- The function SankeyChart takes a digraph as input
- digraph can take a table as input
- The table needs two variables: EndNodes can be a two-column string array, and Weight, for the weight of each node
Here is a simple example:
EndNodes = ["a","b";"a","c";"b","d";"b","e"];
Weight = [5 2 3 1]';
T = table(EndNodes,Weight);
D = digraph(T);
f = uifigure;
SC = SankeyChart( "Parent", f, "GraphData", D );
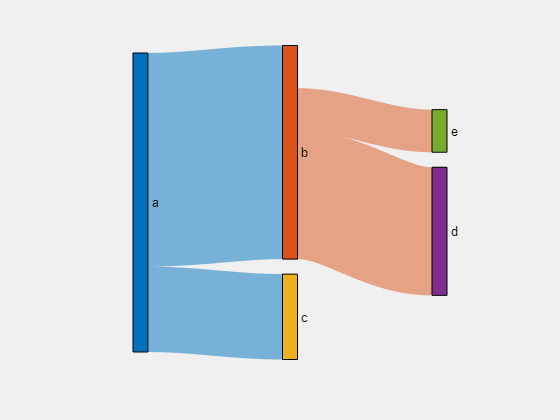
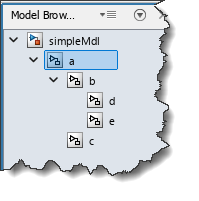
In some sense, it's kind of like a fully expanded Model Browser, with the additional possibility to give weights to each subsystem, corresponding to the number fo blocks they contain.
From Model to Table
The first and most important thing I had to do is create the table. I came up with this simple recursive function:
function T = mdlTable(T,blk)
opts = Simulink.FindOptions;
opts.FollowLinks = true;
opts.SearchDepth = 1;
% Find the subsystems at this level
blks = Simulink.findBlocksOfType(blk,'SubSystem',opts);
% blockpath of the "source" in Sankey
SrcName = string(getfullname(get_param(blk,'handle')));
for i = 1:length(blks)
% blockpath of the "destination" in Sankey
DestName = string(getfullname(blks(i)));
% Number of blocks inside this subsystem
opts.SearchDepth = -1;
Nchilds = max(length(Simulink.findBlocks(blks(i),opts)),1);
% Fill the table
if isempty(T)
T = table([SrcName,DestName], Nchilds,'VariableNames',["EndNodes","Weight"]);
else
T(end+1,:) = {[SrcName,DestName], Nchilds}; %#ok<AGROW>
end
% Run the same on found subsystems
T = mdlTable(T,blks(i));
end
It's probably not the most efficient implementation, especially due to the call to Simulink.findBlocks in the loop, but that will do the job for now.
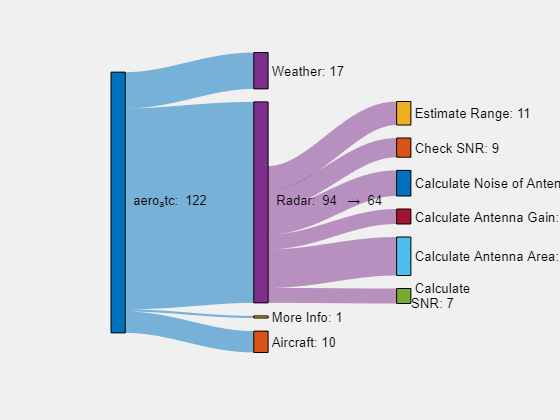
Let's try it with one of our shipping examples: Air Traffic Control Radar Design
openExample('simulink_aerospace/AirTrafficControlRadarDesignExample','workDir',pwd)
open_system('aero_atc');
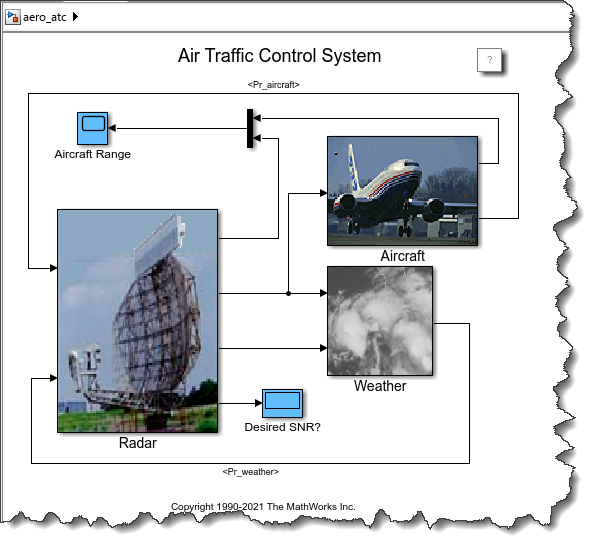
Just looking at the top level, can you guess if there are more blocks inside Radar, Aircraft, or Weather?
T = table();
T = mdlTable(T,'aero_atc')
From Table to Sankey
Once the table is created, I can create the digraph and the Sankey diagram:
DG = digraph(T);
f = uifigure;
SC = SankeyChart( "Parent", f, "GraphData", DG );
SC.LabelIncludeTotal = "on";
SC = fixBlockNames(SC);
The last line fixBlkNames is a simple function I created to replace the blockpaths with the block names. Using the full blockpath easily becomes large, cluttering the diagram.
Larger Models
I tried with a few larger models. This made me realize that many small subsystems with just a few blocks are often cluttering the diagram. So I decided to include a threshold and filter out those small subsystems. Here is my final function:
function SC = mdlSankey(mdl,lim)
arguments
mdl char
lim (1,1) {mustBeNumeric} = 1;
end
warning('off','SankeyChart:UnbalancedGraph');
% Fill the table with find_system
T = mdlTable(table(),mdl);
% Cut elements with less blocks than "lim"
T(T.Weight<lim,:) = [];
% create digraph
DG = digraph(T);
% Plot
f = uifigure;
SC = SankeyChart( "Parent", f, "GraphData", DG );
SC.LabelIncludeTotal = "on";
% Fix labels
SC = fixBlockNames(SC);
end
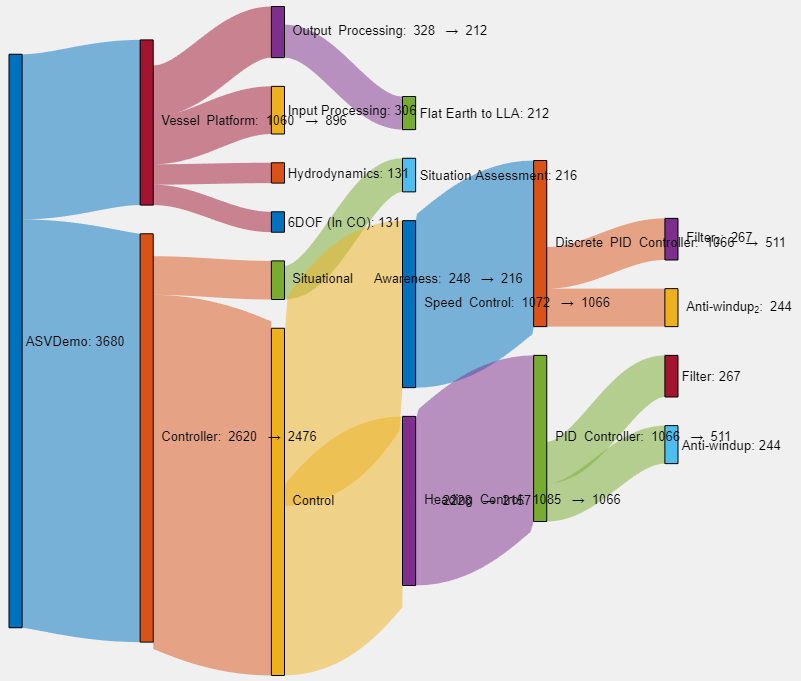
Here is what it looks like for example Collision Avoidance and Trajectory Tracking of a Marine Vessel, which contains 3680 blocks, with the diagram limited to subsystems with more than 100 blocks:
I tried pushing my luck a bit and plotted the Double Lane Change Reference Application from the Vehicle Dynamics Blockset, which contains 12,000 blocks. Here is the result with the limit set to 100 blocks:

Other Tools
While we are on that topic, here is a list of tools included with Simulink to help capturing what is inside a model:
- Model Maintainability Metrics: Included with Simulink Check, this tool helps you assess your model and other design artifacts with respect to many metrics like size, architecture, and complexity
- Dependency Analyzer: An interactive tool for visualizing the files needed and impacted by a Simulink model.
- sldiagnostics: Has a CountBlocks option to return the number of blocks for each BlockType in a model
- find_mdlrefs: Returns the list of model blocks in a model, and the models they reference
- Simulink.findBlocks and Simulink.findBlocksOfType: If you need to create a custom tool like I did in this post, that's probably the core API you will need to analyze what is in your model.
Now it's your turn
The code presented here is obviously in a rough shape, I only spent an hour putting that together. If you think this is useful and worth polishing, or have suggestions for improvements, let me know in the comments below. If you try my code with your model and run into issues, also let me know in the comments below.


댓글
댓글을 남기려면 링크 를 클릭하여 MathWorks 계정에 로그인하거나 계정을 새로 만드십시오.