Student Lounge

Sharing technical and real-life examples of how students can use MATLAB and Simulink in their everyday projects #studentsuccess

Predicting Time to Diagnosis for the WiDS Datathon #2

In today’s blog, Grace Woolson will show how you can use MATLAB and machine learning to make meaningful deductions from healthcare data for patients who have been diagnosed with metastatic breast cancer. Over to you Grace!

Introduction

In this blog, I will show how you can use MATLAB for the WiDS Datathon 2024 using the dataset for the WiDS Datathon #2, which runs from April 9th 2024 – June 1st 2024. This challenge tasks participants with creating a model that can predict how long it takes for a patient with metastatic breast cancer to receive a diagnosis based on patient and geographic data. This can help identify relationships between demographics or environmental conditions with the likelihood of getting timely treatment. Please note that this tutorial is based on a subset of the data and there may be slight differences between this dataset and the one you download from Kaggle.
MathWorks is happy to support participants of the Women in Data Science Datathon 2024 by providing complimentary MATLAB licenses, tutorials, workshops, and additional resources. To request complimentary licenses for you and your teammates, go to this MathWorks site, click the “Request Software” button, and fill out the software request form.
This tutorial will walk through the following steps of the model-making process:
  1. Importing a Tabular Dataset
  2. Preprocessing the Data
  3. Exploring Tabular Data
  4. Choosing and Creating Features
  5. Training a Machine Learning Model
  6. Making New Predictions and Exporting Submissions

Import Data

First, make sure the ‘Current Folder’ is the folder where you saved the data. If you have not already done so, you can download the data from Kaggle after you register for the datathon. The data is provided as a .CSV file, so you can use the readtable function to import the whole file as a table.
dataFolder = fullfile(pwd);
trainDataFilename = ‘training.csv’;
allTrainData = readtable(fullfile(dataFolder, trainDataFilename))
allTrainData = 13173×152 table
patient_id patient_race payer_type patient_state patient_zip3 Region Division patient_age patient_gender bmi breast_cancer_diagnosis_code breast_cancer_diagnosis_desc metastatic_cancer_diagnosis_code metastatic_first_novel_treatment metastatic_first_novel_treatment_type population density age_median age_under_10 age_10_to_19 age_20s age_30s age_40s age_50s age_60s age_70s age_over_80 male female married
1 268700 ‘COMMERCIAL’ ‘AR’ 724 ‘South’ ‘West South Central’ 39 ‘F’ NaN ‘C50912’ ‘Malignant neoplasm of unspecified site of left female breast’ ‘C773’ NaN NaN 3.9249e+03 82.6283 42.5750 11.6050 13.0317 10.8667 11.8017 12.2917 13.2167 13.4717 10.0717 3.6350 51.4317 48.5683 51.0483
2 484983 ‘White’ ‘IL’ 629 ‘Midwest’ ‘East North Central’ 55 ‘F’ 35.3600 ‘C50412’ ‘Malig neoplasm of upper-outer quadrant of left female breast’ ‘C773’ NaN NaN 2.7454e+03 51.7936 43.5351 11.2247 12.1922 11.4467 11.0065 11.3545 14.3922 14.1507 9.1727 5.0506 49.3234 50.6766 49.4753
3 277055 ‘COMMERCIAL’ ‘CA’ 925 ‘West’ ‘Pacific’ 59 ‘F’ NaN ‘1749’ ‘Malignant neoplasm of breast (female), unspecified’ ‘C773’ NaN NaN 3.8343e+04 700.3375 36.2795 13.2667 15.6641 13.4949 13.4538 12,4000 11.5846 10.4667 6.3769 3.2846 49.9897 50.0103 48.8077
4 320055 ‘Hispanic’ ‘MEDICAID’ ‘CA’ 900 ‘West’ ‘Pacific’ 59 ‘F’ NaN ‘C50911’ ‘Malignant neoplasm of unsp site of right female breast’ ‘C773’ NaN NaN 3.6054e+04 5.2943e+03 36.6538 9.7615 11.2677 17.2339 17.4415 13.0908 12.3046 9.4077 5.6738 3.8246 50.5108 49.4892 33.4785
5 190386 ‘COMMERCIAL’ ‘CA’ 934 ‘West’ ‘Pacific’ 71 ‘F’ NaN ‘1748’ ‘Malignant neoplasm of other specified sites of female breast’ ‘C7951’ NaN NaN 1.3700e+04 400.4763 41.7816 10.0316 16.4342 12.9710 11.2921 10.0868 11.5605 13.2790 8.7842 5.5316 51.9895 48.0132 48.2079
6 559027 ‘COMMERCIAL’ ‘IN’ 461 ‘Midwest’ ‘East North Central’ 63 ‘F’ NaN ‘1749’ ‘Malignant neoplasm of breast (female), unspecified’ ‘C786’ NaN NaN 9.3229e+03 274.7371 40.1237 12.2300 13.8800 11.5317 11.9350 12.5517 13.9117 13.0467 7 3.9067 50.9817 49.0183 57.1617
7 293747 ‘White’ ‘MEDICARE ADVANTAGE’ ‘OH’ 448 ‘Midwest’ ‘East North Central’ 57 ‘F’ 33.1000 ‘C50412’ ‘Malig neoplasm of upper-outer quadrant of left female breast’ ‘C799’ NaN NaN 5.8906e+03 122.3929 42.4536 12.4286 13.1893 10.8089 10.7321 13.0411 13.2786 14.2804 7.5732 4.6786 49.9107 50.0893 55.8696
8 517596 ‘White’ ‘COMMERCIAL’ ‘DE’ 198 ‘South’ ‘South Atlantic’ 56 ‘F’ 31.0500 ‘C50411’ ‘Malig neoplm of upper-outer quadrant of right female breast’ ‘C792’ NaN NaN 2.2036e+04 1.4505e+03 41.6300 11.0300 11.9800 12.1100 13.6900 11.6600 13.9500 12.9700 7.6900 4.9700 47.8200 52.1800 42.0300
9 533188 ‘COMMERCIAL’ ‘LA’ 706 ‘South’ ‘West South Central’ 65 ‘F’ NaN ‘C50212’ ‘Malig neoplasm of upper-inner quadrant of left female breast’ ‘C773’ NaN NaN 7.2198e+03 531.0590 39.5421 12.4474 14.7868 11.0026 12.5368 11.6868 14.6947 12.4789 5.8816 4.4947 50.5500 49.4500 49.0737
10 639484 ‘White’ ‘COMMERCIAL’ ‘CA’ 922 ‘West’ ‘Pacific’ 60 ‘F’ NaN ‘C50912’ ‘Malignant neoplasm of unspecified site of left female breast’ ‘C773’ NaN NaN 1.6550e+04 245.0979 44.2326 9.8872 10.4149 13.6723 11.3894 9.1447 15.5638 14.6277 10.1106 5.2298 54.2000 45.8000 46.5192
11 366431 ‘Black’ ‘MEDICARE ADVANTAGE’ ‘PA’ 191 ‘Northeast’ ‘Middle Atlantic’ 71 ‘F’ NaN ‘C50911’ ‘Malignant neoplasm of unsp site of right female breast’ ‘C7989’ NaN NaN 3.1948e+04 5.5122e+03 35.7191 10.8532 10.9511 18.1596 17.3489 11.6468 11.0979 10.6425 5.9426 3.3511 48.3085 51.6915 32.4915
12 793091 ‘White’ ‘MEDICARE ADVANTAGE’ ‘OH’ 453 ‘Midwest’ ‘East North Central’ 73 ‘F’ 23.6100 ‘C50811’ ‘Malignant neoplasm of ovrlp sites of right female breast’ ‘C773’ NaN NaN 6.4682e+03 196.6312 40.5818 12.2182 14.1455 12.2714 11.5338 12.0546 13.7792 12.8234 7.2948 3.8766 50.0740 49.9260 56.5662
13 834862 ‘White’ ‘MEDICARE ADVANTAGE’ ‘MN’ 481 ‘Midwest’ ‘West North Central’ 47 ‘F’ NaN ‘1749’ ‘Malignant neoplasm of breast (female), unspecified’ ‘C773’ NaN NaN 1.2190e+04 249.1628 40.7686 12.8465 14.0198 10.0698 12.7035 12.9919 14.9977 12.1826 6.5198 3.6779 50.9942 49.0058 58.1977
14 834862 ‘White’ ‘COMMERCIAL’ ‘MI’ 481 ‘Midwest’ ‘East North Central’ 47 ‘F’ 26 ‘1749’ ‘Malignant neoplasm of breast (female), unspecified’ ‘C773’ NaN NaN 2.3266+04 743.5571 41.4729 10.9443 13.5914 12.6671 11.6100 12.1371 14.6457 12.7271 7.9286 3.7514 49.4800 50.5200 50.2657
I want to see some high-level statistics about the data, so I’ll use the summary function to get an idea of what kind of information we have.
summary(allTrainData)

Variables:

patient_id: 13173×1 double

Properties:
Description: patient_id
Values:

Min 1.0004e+05
Median 5.5577e+05
Max 9.9998e+05

patient_race: 13173×1 cell array of character vectors

Properties:
Description: patient_race
payer_type: 13173×1 cell array of character vectors

Properties:
Description: payer_type
patient_state: 13173×1 cell array of character vectors

Properties:
Description: patient_state
patient_zip3: 13173×1 double

Properties:
Description: patient_zip3
Values:

Min 100
Median 557
Max 995

Region: 13173×1 cell array of character vectors

Properties:
Description: Region
Division: 13173×1 cell array of character vectors

Properties:
Description: Division
patient_age: 13173×1 double

Properties:
Description: patient_age
Values:

Min 18
Median 59
Max 91

patient_gender: 13173×1 cell array of character vectors

Properties:
Description: patient_gender
bmi: 13173×1 double

Properties:
Description: bmi
Values:

Min 15
Median 28.58
Max 97
NumMissing 9071

breast_cancer_diagnosis_code: 13173×1 cell array of character vectors

Properties:
Description: breast_cancer_diagnosis_code
breast_cancer_diagnosis_desc: 13173×1 cell array of character vectors

Properties:
Description: breast_cancer_diagnosis_desc
metastatic_cancer_diagnosis_code: 13173×1 cell array of character vectors

Properties:
Description: metastatic_cancer_diagnosis_code
metastatic_first_novel_treatment: 13173×1 double

Properties:
Description: metastatic_first_novel_treatment
Values:

Min NaN
Median NaN
Max NaN
NumMissing 13173

metastatic_first_novel_treatment_type: 13173×1 double

Properties:
Description: metastatic_first_novel_treatment_type
Values:

Min NaN
Median NaN
Max NaN
NumMissing 13173

population: 13173×1 double

Properties:
Description: population
Values:

Min 635.55
Median 18953
Max 71374

density: 13173×1 double

Properties:
Description: density
Values:

Min 0.91667
Median 700.34
Max 29852

age_median: 13173×1 double

Properties:
Description: age_median
Values:

Min 20.6
Median 40.639
Max 54.57

age_under_10: 13173×1 double

Properties:
Description: age_under_10
Values:

Min 0
Median 11.004
Max 17.675

age_10_to_19: 13173×1 double

Properties:
Description: age_10_to_19
Values:

Min 6.3143
Median 12.898
Max 35.3

age_20s: 13173×1 double

Properties:
Description: age_20s
Values:

Min 5.925
Median 12.532
Max 62.1

age_30s: 13173×1 double

Properties:
Description: age_30s
Values:

Min 1.5
Median 12.404
Max 25.471

age_40s: 13173×1 double

Properties:
Description: age_40s
Values:

Min 0.8
Median 12.124
Max 17.82

age_50s: 13173×1 double

Properties:
Description: age_50s
Values:

Min 0
Median 13.57
Max 21.661

age_60s: 13173×1 double

Properties:
Description: age_60s
Values:

Min 0.2
Median 12.518
Max 24.51

age_70s: 13173×1 double

Properties:
Description: age_70s
Values:

Min 0
Median 7.325
Max 19

age_over_80: 13173×1 double

Properties:
Description: age_over_80
Values:

Min 0
Median 3.8246
Max 18.825

male: 13173×1 double

Properties:
Description: male
Values:

Min 39.725
Median 49.976
Max 61.6

female: 13173×1 double

Properties:
Description: female
Values:

Min 38.4
Median 50.024
Max 60.275

married: 13173×1 double

Properties:
Description: married
Values:

Min 0.9
Median 49.434
Max 66.903

divorced: 13173×1 double

Properties:
Description: divorced
Values:

Min 0.2
Median 12.717
Max 21.033

never_married: 13173×1 double

Properties:
Description: never_married
Values:

Min 13.44
Median 32.011
Max 98.9

widowed: 13173×1 double

Properties:
Description: widowed
Values:

Min 0
Median 5.5507
Max 20.65

family_size: 13173×1 double

Properties:
Description: family_size
Values:

Min 2.5504
Median 3.16
Max 4.1723
NumMissing 5

family_dual_income: 13173×1 double

Properties:
Description: family_dual_income
Values:

Min 19.312
Median 52.592
Max 65.635
NumMissing 5

income_household_median: 13173×1 double

Properties:
Description: income_household_median
Values:

Min 29222
Median 69730
Max 1.6412e+05
NumMissing 5

income_household_under_5: 13173×1 double

Properties:
Description: income_household_under_5
Values:

Min 0.75
Median 2.8848
Max 19.62
NumMissing 5

income_household_5_to_10: 13173×1 double

Properties:
Description: income_household_5_to_10
Values:

Min 0.36154
Median 2.1986
Max 11.872
NumMissing 5

income_household_10_to_15: 13173×1 double

Properties:
Description: income_household_10_to_15
Values:

Min 1.0154
Median 3.7875
Max 14.278
NumMissing 5

income_household_15_to_20: 13173×1 double

Properties:
Description: income_household_15_to_20
Values:

Min 1.0278
Median 3.7883
Max 12.4
NumMissing 5

income_household_20_to_25: 13173×1 double

Properties:
Description: income_household_20_to_25
Values:

Min 1.1
Median 4.0421
Max 14.35
NumMissing 5

income_household_25_to_35: 13173×1 double

Properties:
Description: income_household_25_to_35
Values:

Min 2.65
Median 8.4349
Max 26.55
NumMissing 5

income_household_35_to_50: 13173×1 double

Properties:
Description: income_household_35_to_50
Values:

Min 1.7
Median 11.833
Max 24.075
NumMissing 5

income_household_50_to_75: 13173×1 double

Properties:
Description: income_household_50_to_75
Values:

Min 4.95
Median 17.076
Max 27.13
NumMissing 5

income_household_75_to_100: 13173×1 double

Properties:
Description: income_household_75_to_100
Values:

Min 4.7333
Median 12.677
Max 24.8
NumMissing 5

income_household_100_to_150: 13173×1 double

Properties:
Description: income_household_100_to_150
Values:

Min 4.2889
Median 15.938
Max 27.477
NumMissing 5

income_household_150_over: 13173×1 double

Properties:
Description: income_household_150_over
Values:

Min 0.84
Median 14.655
Max 52.824
NumMissing 5

income_household_six_figure: 13173×1 double

Properties:
Description: income_household_six_figure
Values:

Min 5.6926
Median 30.523
Max 69.032
NumMissing 5

income_individual_median: 13173×1 double

Properties:
Description: income_individual_median
Values:

Min 4316
Median 35211
Max 88910

home_ownership: 13173×1 double

Properties:
Description: home_ownership
Values:

Min 15.85
Median 69.91
Max 90.367
NumMissing 5

housing_units: 13173×1 double

Properties:
Description: housing_units
Values:

Min 0
Median 6994.4
Max 25923

home_value: 13173×1 double

Properties:
Description: home_value
Values:

Min 60629
Median 2.4116e+05
Max 1.8531e+06
NumMissing 5

rent_median: 13173×1 double

Properties:
Description: rent_median
Values:

Min 448.4
Median 1155.4
Max 2965.2
NumMissing 5

rent_burden: 13173×1 double

Properties:
Description: rent_burden
Values:

Min 17.791
Median 30.829
Max 108.6
NumMissing 5

education_less_highschool: 13173×1 double

Properties:
Description: education_less_highschool
Values:

Min 0
Median 10.745
Max 34.325

education_highschool: 13173×1 double

Properties:
Description: education_highschool
Values:

Min 0
Median 27.484
Max 53.96

education_some_college: 13173×1 double

Properties:
Description: education_some_college
Values:

Min 7.2
Median 29.286
Max 50.133

education_bachelors: 13173×1 double

Properties:
Description: education_bachelors
Values:

Min 2.4657
Median 18.871
Max 41.7

education_graduate: 13173×1 double

Properties:
Description: education_graduate
Values:

Min 2.0941
Median 10.777
Max 51.84

education_college_or_above: 13173×1 double

Properties:
Description: education_college_or_above
Values:

Min 7.0488
Median 29.793
Max 77.817

education_stem_degree: 13173×1 double

Properties:
Description: education_stem_degree
Values:

Min 23.915
Median 42.99
Max 73

labor_force_participation: 13173×1 double

Properties:
Description: labor_force_participation
Values:

Min 30.7
Median 62.778
Max 78.67

unemployment_rate: 13173×1 double

Properties:
Description: unemployment_rate
Values:

Min 0.82308
Median 5.4857
Max 18.8

self_employed: 13173×1 double

Properties:
Description: self_employed
Values:

Min 2.263
Median 12.73
Max 25.538
NumMissing 5

farmer: 13173×1 double

Properties:
Description: farmer
Values:

Min 0
Median 0.45493
Max 25.267
NumMissing 5

race_white: 13173×1 double

Properties:
Description: race_white
Values:

Min 14.496
Median 70.904
Max 98.444

race_black: 13173×1 double

Properties:
Description: race_black
Values:

Min 0.08
Median 6.4103
Max 69.66

race_asian: 13173×1 double

Properties:
Description: race_asian
Values:

Min 0
Median 2.8214
Max 49.85

race_native: 13173×1 double

Properties:
Description: race_native
Values:

Min 0
Median 0.42759
Max 76.935

race_pacific: 13173×1 double

Properties:
Description: race_pacific
Values:

Min 0
Median 0.05
Max 14.758

race_other: 13173×1 double

Properties:
Description: race_other
Values:

Min 0.002564
Median 3.52
Max 33.189

race_multiple: 13173×1 double

Properties:
Description: race_multiple
Values:

Min 0.43333
Median 5.65
Max 26.43

hispanic: 13173×1 double

Properties:
Description: hispanic
Values:

Min 0.060714
Median 11.983
Max 91.005

disabled: 13173×1 double

Properties:
Description: disabled
Values:

Min 4.6
Median 12.955
Max 35.156

poverty: 13173×1 double

Properties:
Description: poverty
Values:

Min 3.4333
Median 12.209
Max 38.348
NumMissing 5

limited_english: 13173×1 double

Properties:
Description: limited_english
Values:

Min 0
Median 2.7472
Max 26.755
NumMissing 5

commute_time: 13173×1 double

Properties:
Description: commute_time
Values:

Min 12.461
Median 27.786
Max 48.02

health_uninsured: 13173×1 double

Properties:
Description: health_uninsured
Values:

Min 2.44
Median 7.3556
Max 27.566

veteran: 13173×1 double

Properties:
Description: veteran
Values:

Min 1.2
Median 6.9933
Max 25.2

AverageOfJan_13: 13173×1 double

Properties:
Description: Average of Jan-13
Values:

Min 6.7891
Median 35.412
Max 72.373
NumMissing 33

AverageOfFeb_13: 13173×1 double

Properties:
Description: Average of Feb-13
Values:

Min 8.9344
Median 36.71
Max 71.003
NumMissing 3

AverageOfMar_13: 13173×1 double

Properties:
Description: Average of Mar-13
Values:

Min 14.001
Median 40.585
Max 70.707

AverageOfApr_13: 13173×1 double

Properties:
Description: Average of Apr-13
Values:

Min 29.303
Median 53.65
Max 76.73

AverageOfMay_13: 13173×1 double

Properties:
Description: Average of May-13
Values:

Min 43.258
Median 63.891
Max 81.449
NumMissing 3

AverageOfJun_13: 13173×1 double

Properties:
Description: Average of Jun-13
Values:

Min 56.635
Median 71.18
Max 91.641
NumMissing 20

AverageOfJul_13: 13173×1 double

Properties:
Description: Average of Jul-13
Values:

Min 60.114
Median 74.462
Max 96.454

AverageOfAug_13: 13173×1 double

Properties:
Description: Average of Aug-13
Values:

Min 56.867
Median 72.511
Max 92.333
NumMissing 17

AverageOfSep_13: 13173×1 double

Properties:
Description: Average of Sep-13
Values:

Min 48.108
Median 68.27
Max 86.437
NumMissing 27

AverageOfOct_13: 13173×1 double

Properties:
Description: Average of Oct-13
Values:

Min 39.809
Median 57.171
Max 80.183
NumMissing 59

AverageOfNov_13: 13173×1 double

Properties:
Description: Average of Nov-13
Values:

Min 24.242
Median 43.371
Max 76.612
NumMissing 3

AverageOfDec_13: 13173×1 double

Properties:
Description: Average of Dec-13
Values:

Min -1.1231
Median 36.49
Max 74.47
NumMissing 3

AverageOfJan_14: 13173×1 double

Properties:
Description: Average of Jan-14
Values:

Min -2.863
Median 31.096
Max 70.775
NumMissing 4

AverageOfFeb_14: 13173×1 double

Properties:
Description: Average of Feb-14
Values:

Min 0.39012
Median 34.685
Max 73.245
NumMissing 9

AverageOfMar_14: 13173×1 double

Properties:
Description: Average of Mar-14
Values:

Min 13.962
Median 41.958
Max 72.13
NumMissing 29

AverageOfApr_14: 13173×1 double

Properties:
Description: Average of Apr-14
Values:

Min 32.845
Median 55.348
Max 76.205
NumMissing 180

AverageOfMay_14: 13173×1 double

Properties:
Description: Average of May-14
Values:

Min 46.646
Median 64.027
Max 80.57

AverageOfJun_14: 13173×1 double

Properties:
Description: Average of Jun-14
Values:

Min 51.611
Median 71.413
Max 90.224
NumMissing 152

AverageOfJul_14: 13173×1 double

Properties:
Description: Average of Jul-14
Values:

Min 57.604
Median 73.955
Max 95.528

AverageOfAug_14: 13173×1 double

Properties:
Description: Average of Aug-14
Values:

Min 56.561
Median 73.225
Max 90.17

AverageOfSep_14: 13173×1 double

Properties:
Description: Average of Sep-14
Values:

Min 42.48
Median 67.588
Max 87.833

AverageOfOct_14: 13173×1 double

Properties:
Description: Average of Oct-14
Values:

Min 34.796
Median 58.049
Max 82.105

AverageOfNov_14: 13173×1 double

Properties:
Description: Average of Nov-14
Values:

Min 19.001
Median 41.864
Max 74.565
NumMissing 24

AverageOfDec_14: 13173×1 double

Properties:
Description: Average of Dec-14
Values:

Min 15.782
Median 39.631
Max 72.174

AverageOfJan_15: 13173×1 double

Properties:
Description: Average of Jan-15
Values:

Min 9.6504
Median 34.297
Max 70.595
NumMissing 6

AverageOfFeb_15: 13173×1 double

Properties:
Description: Average of Feb-15
Values:

Min 0.39436
Median 33.389
Max 72.165
NumMissing 12

AverageOfMar_15: 13173×1 double

Properties:
Description: Average of Mar-15
Values:

Min 21.481
Median 45.209
Max 75.841
NumMissing 12

AverageOfApr_15: 13173×1 double

Properties:
Description: Average of Apr-15
Values:

Min 38.365
Median 55.409
Max 79.593
NumMissing 28

AverageOfMay_15: 13173×1 double

Properties:
Description: Average of May-15
Values:

Min 44.952
Median 64.963
Max 80.898

AverageOfJun_15: 13173×1 double

Properties:
Description: Average of Jun-15
Values:

Min 55.876
Median 71.144
Max 92.338

AverageOfJul_15: 13173×1 double

Properties:
Description: Average of Jul-15
Values:

Min 58.114
Median 74.724
Max 92.895

AverageOfAug_15: 13173×1 double

Properties:
Description: Average of Aug-15
Values:

Min 56.368
Median 74.452
Max 95.258
NumMissing 22

AverageOfSep_15: 13173×1 double

Properties:
Description: Average of Sep-15
Values:

Min 46.958
Median 71.177
Max 98.951

AverageOfOct_15: 13173×1 double

Properties:
Description: Average of Oct-15
Values:

Min 41.013
Median 57.607
Max 82.79
NumMissing 16

AverageOfNov_15: 13173×1 double

Properties:
Description: Average of Nov-15
Values:

Min 26.877
Median 48.956
Max 79.126
NumMissing 16

AverageOfDec_15: 13173×1 double

Properties:
Description: Average of Dec-15
Values:

Min 16.14
Median 46.322
Max 77.383
NumMissing 18

AverageOfJan_16: 13173×1 double

Properties:
Description: Average of Jan-16
Values:

Min 9.633
Median 33.117
Max 71.904
NumMissing 16

AverageOfFeb_16: 13173×1 double

Properties:
Description: Average of Feb-16
Values:

Min 14.552
Median 39.459
Max 77.696
NumMissing 16

AverageOfMar_16: 13173×1 double

Properties:
Description: Average of Mar-16
Values:

Min 29.155
Median 50.109
Max 74.822

AverageOfApr_16: 13173×1 double

Properties:
Description: Average of Apr-16
Values:

Min 35.264
Median 55.783
Max 76.571

AverageOfMay_16: 13173×1 double

Properties:
Description: Average of May-16
Values:

Min 45.325
Median 61.856
Max 79.608
NumMissing 19

AverageOfJun_16: 13173×1 double

Properties:
Description: Average of Jun-16
Values:

Min 55.897
Median 72.583
Max 94.287

AverageOfJul_16: 13173×1 double

Properties:
Description: Average of Jul-16
Values:

Min 60.402
Median 76.48
Max 95.633
NumMissing 16

AverageOfAug_16: 13173×1 double

Properties:
Description: Average of Aug-16
Values:

Min 58.124
Median 76.37
Max 96.091

AverageOfSep_16: 13173×1 double

Properties:
Description: Average of Sep-16
Values:

Min 50.671
Median 70.889
Max 85.494

AverageOfOct_16: 13173×1 double

Properties:
Description: Average of Oct-16
Values:

Min 37.083
Median 60.207
Max 79.631

AverageOfNov_16: 13173×1 double

Properties:
Description: Average of Nov-16
Values:

Min 25.945
Median 49.15
Max 75.547
NumMissing 3

AverageOfDec_16: 13173×1 double

Properties:
Description: Average of Dec-16
Values:

Min 9.8677
Median 36.823
Max 75.628
NumMissing 13

AverageOfJan_17: 13173×1 double

Properties:
Description: Average of Jan-17
Values:

Min 10.249
Median 37.942
Max 71.952
NumMissing 9

AverageOfFeb_17: 13173×1 double

Properties:
Description: Average of Feb-17
Values:

Min 17.485
Median 44.27
Max 72.402

AverageOfMar_17: 13173×1 double

Properties:
Description: Average of Mar-17
Values:

Min 20.439
Median 47.794
Max 73.785

AverageOfApr_17: 13173×1 double

Properties:
Description: Average of Apr-17
Values:

Min 38.856
Median 57.596
Max 80.696

AverageOfMay_17: 13173×1 double

Properties:
Description: Average of May-17
Values:

Min 46.06
Median 62.719
Max 82.129

AverageOfJun_17: 13173×1 double

Properties:
Description: Average of Jun-17
Values:

Min 53.403
Median 71.213
Max 92.757
NumMissing 1

AverageOfJul_17: 13173×1 double

Properties:
Description: Average of Jul-17
Values:

Min 58.14
Median 75.782
Max 106.73
NumMissing 31

AverageOfAug_17: 13173×1 double

Properties:
Description: Average of Aug-17
Values:

Min 55.428
Median 72.311
Max 94.479

AverageOfSep_17: 13173×1 double

Properties:
Description: Average of Sep-17
Values:

Min 49.352
Median 69.367
Max 85.72
NumMissing 10

AverageOfOct_17: 13173×1 double

Properties:
Description: Average of Oct-17
Values:

Min 38.41
Median 60.651
Max 79.556
NumMissing 21

AverageOfNov_17: 13173×1 double

Properties:
Description: Average of Nov-17
Values:

Min 23.168
Median 46.499
Max 75.306
NumMissing 5

AverageOfDec_17: 13173×1 double

Properties:
Description: Average of Dec-17
Values:

Min 8.609
Median 35.899
Max 71.741

AverageOfJan_18: 13173×1 double

Properties:
Description: Average of Jan-18
Values:

Min 5.9302
Median 33.93
Max 73.314

AverageOfFeb_18: 13173×1 double

Properties:
Description: Average of Feb-18
Values:

Min 4.1048
Median 42.023
Max 75.045
NumMissing 5

AverageOfMar_18: 13173×1 double

Properties:
Description: Average of Mar-18
Values:

Min 22.722
Median 43.237
Max 71.638
NumMissing 6

AverageOfApr_18: 13173×1 double

Properties:
Description: Average of Apr-18
Values:

Min 28.793
Median 50.292
Max 76.49

AverageOfMay_18: 13173×1 double

Properties:
Description: Average of May-18
Values:

Min 45.877
Median 66.117
Max 86.572

AverageOfJun_18: 13173×1 double

Properties:
Description: Average of Jun-18
Values:

Min 53.458
Median 71.642
Max 90.658
NumMissing 9

AverageOfJul_18: 13173×1 double

Properties:
Description: Average of Jul-18
Values:

Min 58.542
Median 76.647
Max 96.432
NumMissing 46

AverageOfAug_18: 13173×1 double

Properties:
Description: Average of Aug-18
Values:

Min 56.201
Median 76.079
Max 95.772
NumMissing 16

AverageOfSep_18: 13173×1 double

Properties:
Description: Average of Sep-18
Values:

Min 51.829
Median 70.876
Max 89.194
NumMissing 7

AverageOfOct_18: 13173×1 double

Properties:
Description: Average of Oct-18
Values:

Min 37.539
Median 57.454
Max 81.46
NumMissing 7

AverageOfNov_18: 13173×1 double

Properties:
Description: Average of Nov-18
Values:

Min 19.145
Median 42.426
Max 76.301
NumMissing 12

AverageOfDec_18: 13173×1 double

Properties:
Description: Average of Dec-18
Values:

Min 15.377
Median 38.496
Max 73.539
NumMissing 33

metastatic_diagnosis_period: 13173×1 double

Properties:
Description: metastatic_diagnosis_period
Values:

Min 0
Median 44
Max 365

Take some time to scroll through this summary and see what information or patterns you can learn! Here are some things I notice:
  1. There are a lot of rows or variables that just say “cell array of character vectors”, which doesn’t tell us much about the data.
  2. There are a few variables that have a high ‘NumMissing’ value.
  3. The numeric variables can have dramatically different minimums and maximums.
We can use these observations to make decisions about how we want to explore and preprocess the dataset.

Process and Clean the Data

1. Convert text data to categorical

Text data can be hard for machine learning algorithms to understand, so let’s go through and change each “cell array of character vectors” to a categorical. This will help the algorithm sort the text into different categories instead of understanding it as a series of individual letters.
varTypes = varfun(@class, allTrainData, OutputFormat=“cell”);
catIdx = strcmp(varTypes, “cell”);
varNames = allTrainData.Properties.VariableNames;
catVarNames = varNames(catIdx);
for catNameIdx = 1:length(catVarNames)
allTrainData.(catVarNames{catNameIdx}) = categorical(allTrainData.(catVarNames{catNameIdx}));
end

2. Handle Missing Data

Now I want to handle all that missing data I noticed earlier. I’ll go through each variable and specifically look at variables that are missing data for over half of the rows or observations.
dataSum = summary(allTrainData);
for nameIdx = 1:length(varNames)
varName = varNames{nameIdx};
varNumMissing = dataSum.(varName).NumMissing;
if varNumMissing > (height(allTrainData) / 2)
disp(varName);
disp(varNumMissing);
end
end
patient_race
6657
bmi
9071
metastatic_first_novel_treatment
13173
metastatic_first_novel_treatment_type
13173
Let’s remove those variables entirely, since they might not be too helpful for our algorithm.
allTrainData = removevars(allTrainData, [“patient_race”, “bmi”, “metastatic_first_novel_treatment”, “metastatic_first_novel_treatment_type”])
allTrainData = 13173×148 table
patient_id payer_type patient_state patient_zip3 Region Division patient_age patient_gender breast_cancer_diagnosis_code breast_cancer_diagnosis_desc metastatic_cancer_diagnosis_code population density age_median age_under_10 age_10_to_19 age_20s age_30s age_40s age_50s age_60s age_70s age_over_80 male female married divorced never_married widowed family_size
1 268700 COMMERCIAL AR 724 South West South Central 39 F C50912 Malignant neoplasm of unspecified site of left female breast C773 3.9249e+03 82.6283 42.5750 11.6050 13.0317 10.8667 11.8017 12.2917 13.2167 13.4717 10.0717 3.6350 51.4317 48.5683 51.0483 16.7233 23.5650 8.6550 3.0093
2 484983 <undefined> IL 629 Midwest East North Central 55 F C50412 Malig neoplasm of upper-outer quadrant of left female breast C773 2.7454e+03 51.7936 43.5351 11.2247 12.1922 11.4467 11.0065 11.3545 14.3922 14.1507 9.1727 5.0506 49.3234 50.6766 49.4753 15.4182 26.9286 8.1714 3.1749
3 277055 COMMERCIAL CA undefined West Pacific 59 F 1749 Malignant neoplasm of breast (female), unspecified C773 3.8343e+04 700.3375 36.2795 13.2667 15.6641 13.4949 13.4538 12.4000 11.5846 10.4667 6.3769 3.2846 49.9897 50.0103 48.8077 11.8974 34.3487 4.9487 3.7977
4 320055 MEDICAID CA 925 West Pacific 59 F C50911 Malignant neoplasm of unsp site of right female breast C773 3.6054e+04 5.2943e+03 36.6538 9.7615 11.2677 17.2339 17.4415 13.0908 12.3046 9.4077 5.6738 3.8246 50.5108 49.4892 33.4785 11.3015 50.4569 4.7662 3.4429
5 190386 COMMERCIAL CA 934 West Pacific 71 F 1748 Malignant neoplasm of other specified sites of female breast C7951 1.3700e+04 400.4763 41.7816 10.0316 16.4342 12.9710 11.2921 10.0868 11.5605 13.2790 8.7842 5.5316 51.9895 48.0132 48.2079 11.1632 35.6026 5.0132 3.0909
6 559027 COMMERCIAL IN 461 Midwest East North Central 63 F 1749 Malignant neoplasm of breast (female), unspecified C786 9.3229e+03 274.7371 40.1237 12.2300 13.8800 11.5317 11.9350 12.5517 13.9117 13.0467 7 3.9067 50.9817 49.0183 57.1617 12.7767 23.5267 6.5333 3.1912
7 293747 MEDICARE ADVANTAGE OH 448 Midwest East North Central 57 F C50412 Malig neoplasm of upper-outer quadrant of left female breast C799 5.8906e+03 122.3929 42.4536 12.4286 13.1893 10.8089 10.7321 13.0411 13.2786 14.2804 7.5732 4.6786 49.9107 50.0893 55.8696 12.4232 24.4518 7.2625 2.9912
8 517596 COMMERCIAL DE 198 South South Atlantic 56 F C50411 Malig neoplm of upper-outer quadrant of right female breast C792 2.2036e+04 1.4505e+03 41.6300 11.0300 11.9800 12.1100 13.6900 11.6600 13.9500 12.9700 7.6900 4.9700 47.8200 52.1800 42.0300 13.3700 38.5100 6.1000 3.0850
9 533188 COMMERCIAL LA 706 South West South Central 65 F C50212 Malig neoplasm of upper-inner quadrant of left female breast C773 7.2198e+03 531.0590 39.5421 12.4474 14.7868 11.0026 12.5368 11.6868 14.6947 12.4789 5.8816 4.4947 50.5500 49.4500 49.0737 17.2132 27.2553 6.4711 3.2531
10 639484 COMMERCIAL CA 922 West Pacific 60 F C50912 Malignant neoplasm of unspecified site of left female breast C773 1.6550e+04 245.0979 44.2326 9.8872 10.4149 13.6723 11.3894 9.1447 15.5638 14.6277 10.1106 5.2298 54.2000 45.8000 46.5192 13.1872 33.9894 6.2957 3.3669
11 366431 MEDICARE ADVANTAGE PA 191 Northeast Middle Atlantic 71 F C50911 Malignant neoplasm of unsp site of right female breast C7989 3.1948e+04 5.5122e+03 35.7191 10.8532 10.9511 18.1596 17.3489 11.6468 11.0979 10.6425 5.9426 3.3511 48.3085 51.6915 32.4915 12.3021 49.7702 5.4298 3.0866
12 793091 MEDICARE ADVANTAGE OH 453 Midwest East North Central 73 F C50811 Malignant neoplasm of ovrlp sites of right female breast C773 6.4682e+03 196.6312 40.5818 12.2182 14.1455 12.2714 11.5338 12.0546 13.7792 12.8234 7.2948 3.8766 50.0740 49.9260 56.5662 11.9610 25.8195 5.6506 3.0866
13 942172 MEDICARE ADVANTAGE MN 553 Midwest West North Central 73 F 1749 Malignant neoplasm of breast (female), unspecified C773 1.2190e+04 249.1628 40.7686 12.8465 14.0198 10.0698 12.7035 12.9919 14.9977 12.1826 6.5198 3.6779 50.9942 49.0058 58.1977 10.6512 26.5395 4.6081 3.1352
14 834862 COMMERCIAL MI 481 Midwest East North Central 47 F 1749 Malignant neoplasm of breast (female), unspecified C773 2.3266e+04 743.5571 41.4729 10.9443 13.5914 12.6671 11.6100 12.1371 14.6457 12.7271 7.9286 3.7514 49.4800 50.5200 50.2657 11.7486 32.4871 5.5043 3.1332
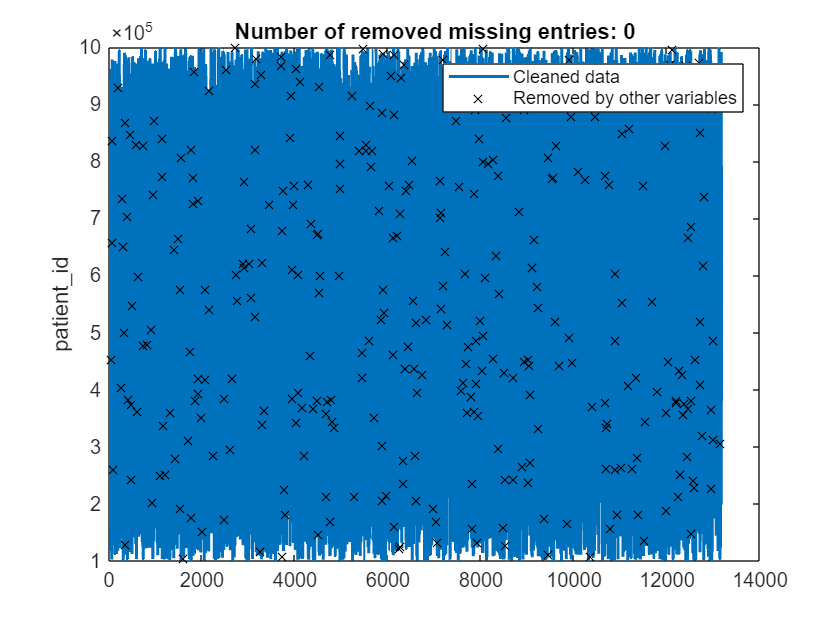
Now I want to look at each row and remove any that are missing too many values. It’s okay to have a couple of missing data points in your dataset, but if you have too many it could cause your machine learning algorithm to be less accurate. I’ll use the Clean Missing Data live task to remove any rows that are missing 2 or more data points.
% Remove missing data
[cleanTrainData,missingIndices] = rmmissing(allTrainData,“MinNumMissing”,2);
% Display results
figure
% Get locations of missing data
indicesForPlot = ismissing(allTrainData.patient_id);
mask = missingIndices & ~indicesForPlot;
% Plot cleaned data
plot(find(~missingIndices),cleanTrainData.patient_id,“SeriesIndex”,1,“LineWidth”,1.5,
“DisplayName”,“Cleaned data”)
hold on
% Plot data in rows where other variables contain missing entries
plot(find(mask),allTrainData.patient_id(mask),“x”,“SeriesIndex”,“none”,
“DisplayName”,“Removed by other variables”)
% Plot removed missing entries
x = repelem(find(indicesForPlot),3);
y = repmat([ylim(gca) missing]’,nnz(indicesForPlot),1);
plot(x,y,“Color”,[145 145 145]/255,“DisplayName”,“Removed missing entries”)
title(“Number of removed missing entries: ” + nnz(indicesForPlot))
hold off
legend
ylabel(“patient_id”,“Interpreter”,“none”)
clear indicesForPlot mask x y

Explore the Data

Now that the data is cleaned up, you should spend some time exploring your data to understand how different variables may interact with each other.

Visual Analysis – Univariate Data

I’ll start by using the kde function to calculate and visualize the kernel density estimate (kde) for individual variables in our dataset. This shows us how the data in that variable is distributed, similar to a histogram, but smooths out the visualization to make it easier to understand the overall distribution and patterns without getting distracted by potential outliers.
I’ll start by visualizing the distribution of patient age to gain a better understanding of the patient data we are working with.
whichColumn = cleanTrainData.patient_age; % Modify this line to explore other variables
[estProbDist,evalPoints] = kde(whichColumn);
plot(evalPoints, estProbDist);
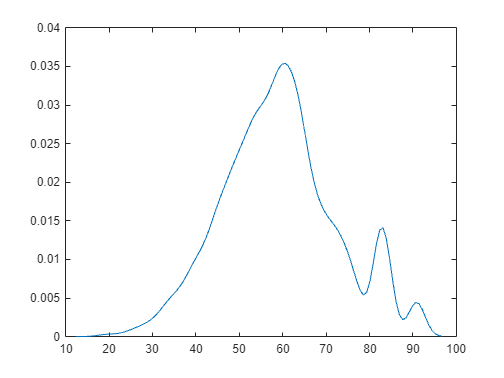
Here we can see that a majority of our patients center around the 60 years old mark, with a few smaller spikes in the 80- and 90-year range. Visualizing your data like this can help you understand where they may be potential gaps in the data or identify patterns in patients who have been diagnosed with metastatic breast cancer.

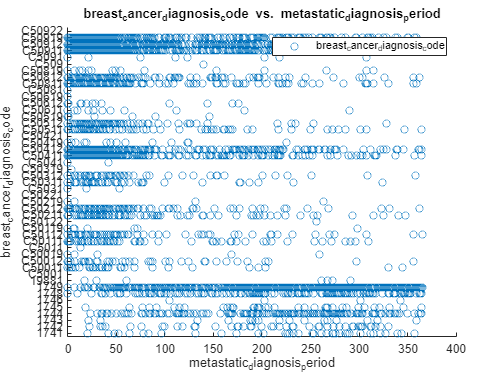
Visual Analysis – Bivariate Data

You can use the Create Plot live task to create scatter plots of the different variables against how long it took for the patient to receive a diagnosis. Here, I’ve plotted ‘breast_cancer_diagnosis_code’ because I noticed most of the codes tend to skew left, meaning they have earlier diagnoses, but some of the codes, such as 1748, skew to the right, indicating that there may be a relationship between diagnosis code and time to diagnosis.
% Create scatter of selected data
s = scatter(cleanTrainData,“metastatic_diagnosis_period”,“breast_cancer_diagnosis_code”,“DisplayName”,“breast_cancer_diagnosis_code”);
% Add xlabel, ylabel, title, and legend
xlabel(“metastatic_diagnosis_period”)
ylabel(“breast_cancer_diagnosis_code”)
title(“breast_cancer_diagnosis_code vs. metastatic_diagnosis_period”)
legend
Take some time to explore these visualizations on your own! This live task allows you to create a variety of different plots, and you can even add multiple plots to the same axes.

Statistical Analysis

You can also create meaningful deductions or additional data by calculating various statistics from your data. For example, let’s add a column that shows how far the patients age is away from the mean age of all patients.
meanAge = mean(cleanTrainData.patient_age);
yearsFromMeanAge = cleanTrainData.patient_age – meanAge;
cleanTrainData = addvars(cleanTrainData, yearsFromMeanAge, ‘Before’, ‘metastatic_diagnosis_period’)
cleanTrainData = 12844×149 table
patient_id payer_type patient_state patient_zip3 Region Division patient_age patient_gender breast_cancer_diagnosis_code breast_cancer_diagnosis_desc metastatic_cancer_diagnosis_code population density age_median age_under_10 age_10_to_19 age_20s age_30s age_40s age_50s age_60s age_70s age_over_80 male female married divorced never_married widowed family_size
1 268700 COMMERCIAL AR 724 South West South Central 39 F C50912 Malignant neoplasm of unspecified site of left female breast C773 3.9249e+03 82.6283 42.5750 11.6050 13.0317 10.8667 11.8017 12.2917 13.2167 13.4717 10.0717 3.6350 51.4317 48.5683 51.0483 16.7233 23.5650 8.6550 3.0093
2 484983 <undefined> IL 629 Midwest East North Central 55 F C50412 Malig neoplasm of upper-outer quadrant of left female breast C773 2.7454e+03 51.7936 43.5351 11.2247 12.1922 11.4467 11.0065 11.3545 14.3922 14.1507 9.1727 5.0506 49.3234 50.6766 49.4753 15.4182 26.9286 8.1714 3.1749
3 277055 COMMERCIAL CA 925 West Pacific 59 F 1749 Malignant neoplasm of breast (female), unspecified C773 3.8343e+04 700.3375 36.2795 13.2667 15.6641 13.4949 13.4538 12.4000 11.5846 10.4667 6.3769 3.2846 49.9897 50.0103 48.8077 11.8974 34.3487 4.9487 3.7977
4 320055 MEDICAID CA 900 West Pacific 59 F C50911 Malignant neoplasm of unsp site of right female breast C773 3.6054e+04 5.2943e+03 36.6538 9.7615 11.2677 17.2339 17.4415 13.0908 12.3046 9.4077 5.6738 3.8246 50.5108 49.4892 33.4785 11.3015 50.4569 4.7662 3.4429
5 190386 COMMERCIAL CA 934 West Pacific 71 F 1748 Malignant neoplasm of other specified sites of female breast C7951 1.3700e+04 400.4763 41.7816 10.0316 16.4342 12.9710 11.2921 10.0868 11.5605 13.2790 8.7842 5.5316 51.9895 48.0132 48.2079 11.1632 35.6026 5.0132 3.0909
6 559027 COMMERCIAL IN 461 Midwest East North Central 63 F 1749 Malignant neoplasm of breast (female), unspecified C786 9.3229e+03 274.7371 40.1237 12.2300 13.8800 11.5317 11.9350 12.5517 13.9117 13.0467 7 3.9067 50.9817 49.0183 57.1617 12.7767 23.5267 6.5333 3.1912
7 293747 MEDICARE ADVANTAGE OH 448 Midwest East North Central 57 F C50412 Malig neoplasm of upper-outer quadrant of left female breast C799 5.8906e+03 122.3929 42.4536 12.4286 13.1893 10.8089 10.7321 13.0411 13.2786 14.2804 7.5732 4.6786 49.9107 50.0893 55.8696 12.4232 24.4518 7.2625 2.9912
8 517596 COMMERCIAL DE 198 South South Atlantic 56 F C50411 Malig neoplm of upper-outer quadrant of right female breast C792 2.2036e+04 1.4505e+03 41.6300 11.0300 11.9800 12.1100 13.6900 11.6600 13.9500 12.9700 7.6900 4.9700 47.8200 52.1800 42.0300 13.3700 38.5100 6.1000 3.0850
9 533188 COMMERCIAL LA 706 South West South Central 65 F C50212 Malig neoplasm of upper-inner quadrant of left female breast C773 7.2198e+03 531.0590 39.5421 12.4474 14.7868 11.0026 12.5368 11.6868 14.6947 12.4789 5.8816 4.4947 50.5500 49.4500 49.0737 17.2132 27.2553 6.4711 3.2531
10 639484 COMMERCIAL CA 922 West Pacific 60 F C50912 Malignant neoplasm of unspecified site of left female breast C773 1.6550e+04 245.0979 44.2326 9.8872 10.4149 13.6723 11.3894 9.1447 15.5638 14.6277 10.1106 5.2298 54.2000 45.8000 46.5192 13.1872 33.9894 6.2957 3.3669
11 366431 MEDICARE ADVANTAGE PA 191 Northeast Middle Atlantic 71 F C50911 Malignant neoplasm of unsp site of right female breast C7989 3.1948e+04 5.5122e+03 35.7191 10.8532 10.9511 18.1596 17.3489 11.6468 11.0979 10.6425 5.9426 3.3511 48.3085 51.6915 32.4915 12.3021 49.7702 5.4298 3.0866
12 793091 MEDICARE ADVANTAGE OH 453 Midwest East North Central 73 F C50811 Malignant neoplasm of ovrlp sites of right female breast C773 6.4682e+03 196.6312 40.5818 12.2182 14.1455 12.2714 11.5338 12.0546 13.7792 12.8234 7.2948 3.8766 50.0740 49.9260 56.5662 11.9610 25.8195 5.6506 3.0866
13 942172 MEDICARE ADVANTAGE MN 553 Midwest West North Central 73 F 1749 Malignant neoplasm of breast (female), unspecified C773 1.2190e+04 249.1628 40.7686 12.8465 14.0198 10.0698 12.7035 12.9919 14.9977 12.1826 6.5198 3.6779 50.9942 49.0058 58.1977 10.6512 26.5395 4.6081 3.1352
14 834862 COMMERCIAL MI 481 Midwest East North Central 47 F 1749 Malignant neoplasm of breast (female), unspecified C773 2.3266e+04 743.5571 41.4729 10.9443 13.5914 12.6671 11.6100 12.1371 14.6457 12.7271 7.9286 3.7514 49.4800 50.5200 50.2657 11.7486 32.4871 5.5043 3.1332
If you scroll all the way to the right of this table, you’ll see a new column called ‘yearsFromMeanAge’ that contains the data we just created! This is just a simple example, but it should give you an idea of how you can investigate and augment your data.

Feature Engineering

When it comes to machine learning, you don’t have to use all of the data as it is presented to you. Feature Engineering is the process of deciding what data you want to use, creating new data based on the provided data, and transforming the data to be in whatever format or range is suitable for your workflow. You can do this manually, and some of the exploration we just did should influence decisions you make if you want to play around with including or excluding different variables.
For this blog, I’ll use the genrfeatures function to automate this process. I want to use 30 features, so MATLAB will go through and create a set of meaningful features based on our processed dataset. It may keep some data as-is, but will often standardize numeric variables and create new variables by manipulating the provided data.
[T, augTrainData] = genrfeatures(cleanTrainData, “metastatic_diagnosis_period”, 30)
T =

FeatureTransformer with properties:

Type: ‘regression’
TargetLearner: ‘linear’
NumEngineeredFeatures: 28
NumOriginalFeatures: 2
TotalNumFeatures: 30

augTrainData = 12844×31 table
breast_cancer_diagnosis_code breast_cancer_diagnosis_desc zsc(cos(yearsFromMeanAge)) zsc(health_uninsured.*yearsFromMeanAge) zsc(AverageOfJan_14-AverageOfFeb_14) zsc(AverageOfOct_16./AverageOfApr_17) zsc(AverageOfJan_13./AverageOfDec_16) eb11(patient_age) eb11(yearsFromMeanAge) zsc(sin(AverageOfNov_18)) zsc(labor_force_participation+disabled) zsc(cos(AverageOfJun_13)) zsc(sin(AverageOfOct_18)) zsc(patient_age./hispanic) zsc(sin(age_20s)) zsc(cos(AverageOfJul_15)) zsc(yearsFromMeanAge.^2) zsc(farmer.*yearsFromMeanAge) zsc(sig(patient_age)) eb24(income_household_100_to_150) zsc(cos(AverageOfDec_17)) zsc(cos(rent_median)) zsc(tanh(age_40s)) zsc(race_black.*race_pacific) eb28(education_graduate) zsc(cos(AverageOfAug_18)) zsc(AverageOfMar_13./AverageOfFeb_16) zsc(sin(AverageOfNov_13)) zsc(cos(AverageOfNov_18)) zsc(health_uninsured./yearsFromMeanAge)
1 C50912 Malignant neoplasm of unspecified site of left female breast 0.1806 -1.2893 0.0690 -0.3920 0.0890 2 2 -1.2710 0.1981 1.0835 -0.4009 0.2163 -1.1510 1.2808 0.9764 -2.2388 0.0280 1 0.6620 1.1890 0.0776 -0.4848 1 -1.2617 -0.5500 1.3750 0.9595 0.0631
2 C50412 Malig neoplasm of upper-outer quadrant of left female breast -0.6655 -0.2150 0.2483 -0.0630 0.3927 5 5 1.2637 -0.6535 0.0614 1.3875 0.6865 -1.0175 -1.3784 -0.6453 -0.4617 0.0280 4 -1.0882 -1.0191 0.0684 -0.3514 3 1.5636 -0.2443 -1.2160 -0.3726 -0.0954
3 1749 Malignant neoplasm of breast (female), unspecified 1.3154 0.0054 0.5232 0.1254 -0.1329 6 6 -0.2890 -0.7538 -0.7796 1.4197 -0.5775 1.4565 1.0324 -0.7200 -0.0024 0.0280 20 -1.2077 -0.6610 0.0780 0.6752 6 -0.9565 -0.2047 -0.9773 1.5936 -3.9151
4 C50911 Malignant neoplasm of unsp site of right female breast 1.3154 6.9626e-04 1.5665 0.4103 0.3231 6 6 0.6535 0.3172 0.9866 -0.2370 -0.5749 -1.1616 -1.3856 -0.7200 -8.3799e-05 0.0280 9 -1.0435 0.2634 0.0790 0.3610 13 1.6817 -1.8093 1.1615 -1.0371 -5.0481
5 1748 Malignant neoplasm of other specified sites of female breast 0.9097 0.6396 1.2400 0.3110 0.0649 9 9 -1.2927 -2.1295 -0.1996 0.8063 -0.5212 0.8644 0.3204 -0.1503 0.3570 0.0280 17 -0.9154 -0.3898 -0.0585 -0.0649 11 0.9956 -1.1728 1.4639 -0.5341 0.1862
6 1749 Malignant neoplasm of breast (female), unspecified -1.2099 0.1862 5.6886e-04 -0.5225 0.1049 7 7 -0.8391 0.7661 -0.8233 -1.2811 1.4600 -0.9590 -0.9225 -0.6624 0.3039 0.0280 21 -0.3768 -1.0583 0.0783 -0.5007 4 1.2107 0.1415 1.4069 1.3855 0.3022
7 C50412 Malig neoplasm of upper-outer quadrant of left female breast -0.9412 -0.1142 0.0602 -0.3997 0.1448 6 6 -1.4337 0.4192 1.2975 -0.1379 0.4657 -1.1378 -0.3066 -0.6992 -0.2427 0.0280 13 -0.8261 -1.3789 0.0790 -0.4774 1 0.3635 0.2951 0.3963 0.6159 -0.3145
8 C50411 Malig neoplm of upper-outer quadrant of right female breast -1.4468 -0.0944 -0.3012 -1.2779 -0.1211 6 6 -0.1400 0.6606 -1.2905 0.1472 -0.1780 -0.3494 0.1091 -0.6764 -4.9683e-05 0.0280 14 -1.1083 -1.2292 0.0734 -0.3837 20 1.2717 1.6932 0.2868 -1.2188 -0.0616
9 C50212 Malig neoplasm of upper-inner quadrant of left female breast 1.1607 0.3906 -1.0540 -0.6968 -0.2237 7 8 -0.4944 -0.7009 1.2929 0.9208 1.0272 -1.1630 -0.6645 -0.5839 0.5773 0.0280 9 0.8457 1.2404 0.0737 1.5897 1 1.2651 -0.1321 -0.8378 1.5453 0.2936
10 C50912 Malignant neoplasm of unspecified site of left female breast 0.9918 0.0709 -0.2100 0.4588 -0.4328 6 6 -1.1849 -1.6220 -1.0465 1.4286 -0.5794 1.5920 0.4326 -0.7180 0.0020 0.0280 4 1.3263 0.4417 -0.8275 -0.1101 4 -0.1867 0.4845 -1.2424 -0.6868 1.5358
11 C50911 Malignant neoplasm of unsp site of right female breast 0.9097 0.6159 -0.2138 -1.4477 -0.7481 9 9 -0.8974 1.3344 -1.2279 -0.0286 -0.2587 -0.6343 0.9810 -0.1503 -4.9683e-05 0.0280 7 -1.2504 1.3439 0.0732 0.1566 17 -0.6010 1.1877 -0.2407 -0.9555 0.1834
12 C50811 Malignant neoplasm of ovrlp sites of right female breast 0.4955 0.5783 -0.3673 -0.4973 0.3141 9 9 -1.2544 0.7968 1.1712 -1.4259 1.4166 -0.1312 -0.4201 0.0604 1.0940 0.0280 17 -1.2310 -0.8610 0.0766 -0.4922 5 0.5016 0.1765 1.2579 0.9843 0.1616
13 1749 Malignant neoplasm of breast (female), unspecified 0.4955 0.4398 0.5914 0.1312 -1.7375 9 9 0.8544 1.4799 -1.2113 -0.9255 0.5154 -0.5829 -0.2644 0.0604 1.1872 0.0280 24 -0.3583 0.8771 0.0789 -0.5004 8 1.0030 0.6482 -1.0818 1.2931 0.1498
14 1749 Malignant neoplasm of breast (female), unspecified 1.2957 -0.4079 -0.3742 -0.0806 -0.1207 4 4 0.5078 -0.2391 0.3034 -0.6520 0.0119 0.4380 0.9356 -0.0990 -0.1350 0.0280 16 1.3104 -1.4723 0.0770 -0.4757 13 -1.2384 0.6673 -1.2145 -1.1079 0.0685
To better understand the generated features, you can use the describe function of the returned FeatureTransformer object, ‘T’.
describe(T)
Type IsOriginal InputVariables Transformations
___________ __________ ___________________________________ ______________________________________________________________breast_cancer_diagnosis_code Categorical true breast_cancer_diagnosis_code
breast_cancer_diagnosis_desc Categorical true breast_cancer_diagnosis_desc
zsc(cos(yearsFromMeanAge)) Numeric false yearsFromMeanAge cos( )
Standardization with z-score (mean = 0.03342, std = 0.70961)
zsc(health_uninsured.*yearsFromMeanAge) Numeric false health_uninsured, yearsFromMeanAge health_uninsured .* yearsFromMeanAge
Standardization with z-score (mean = -2.7558, std = 124.453)
zsc(AverageOfJan_14-AverageOfFeb_14) Numeric false AverageOfJan_14, AverageOfFeb_14 AverageOfJan_14 – AverageOfFeb_14
Standardization with z-score (mean = -2.4227, std = 3.8007)
zsc(AverageOfOct_16./AverageOfApr_17) Numeric false AverageOfOct_16, AverageOfApr_17 AverageOfOct_16 ./ AverageOfApr_17
Standardization with z-score (mean = 1.0531, std = 0.040559)
zsc(AverageOfJan_13./AverageOfDec_16) Numeric false AverageOfJan_13, AverageOfDec_16 AverageOfJan_13 ./ AverageOfDec_16
Standardization with z-score (mean = 0.96755, std = 0.07866)
eb11(patient_age) Categorical false patient_age Equal-width binning (number of bins = 11)
eb11(yearsFromMeanAge) Categorical false yearsFromMeanAge Equal-width binning (number of bins = 11)
zsc(sin(AverageOfNov_18)) Numeric false AverageOfNov_18 sin( )
Standardization with z-score (mean = 0.039513, std = 0.69365)
zsc(labor_force_participation+disabled) Numeric false labor_force_participation, disabled labor_force_participation + disabled
Standardization with z-score (mean = 75.1061, std = 3.7296)
zsc(cos(AverageOfJun_13)) Numeric false AverageOfJun_13 cos( )
Standardization with z-score (mean = 0.014056, std = 0.75911)
zsc(sin(AverageOfOct_18)) Numeric false AverageOfOct_18 sin( )
Standardization with z-score (mean = -0.00117, std = 0.70011)
zsc(patient_age./hispanic) Numeric false patient_age, hispanic patient_age ./ hispanic
Standardization with z-score (mean = 9.7121, std = 14.6393)
zsc(sin(age_20s)) Numeric false age_20s sin( )
Standardization with z-score (mean = -0.20048, std = 0.68741)
zsc(cos(AverageOfJul_15)) Numeric false AverageOfJul_15 cos( )
Standardization with z-score (mean = 0.012229, std = 0.72983)
zsc(yearsFromMeanAge.^2) Numeric false yearsFromMeanAge power( ,2)
Standardization with z-score (mean = 174.2181, std = 241.8873)
zsc(farmer.*yearsFromMeanAge) Numeric false farmer, yearsFromMeanAge farmer .* yearsFromMeanAge
Standardization with z-score (mean = 0.0023864, std = 48.0329)
zsc(sig(patient_age)) Numeric false patient_age sigmoid( )
Standardization with z-score (mean = 1, std = 2.6634e-10)
eb24(income_household_100_to_150) Categorical false income_household_100_to_150 Equal-width binning (number of bins = 24)
zsc(cos(AverageOfDec_17)) Numeric false AverageOfDec_17 cos( )
Standardization with z-score (mean = -0.0045992, std = 0.7565)
zsc(cos(rent_median)) Numeric false rent_median cos( )
Standardization with z-score (mean = 0.053355, std = 0.69262)
zsc(tanh(age_40s)) Numeric false age_40s tanh( )
Standardization with z-score (mean = 1, std = 2.5149e-08)
zsc(race_black.*race_pacific) Numeric false race_black, race_pacific race_black .* race_pacific
Standardization with z-score (mean = 1.0419, std = 2.0598)
eb28(education_graduate) Categorical false education_graduate Equal-width binning (number of bins = 28)
zsc(cos(AverageOfAug_18)) Numeric false AverageOfAug_18 cos( )
Standardization with z-score (mean = -0.13184, std = 0.66549)
zsc(AverageOfMar_13./AverageOfFeb_16) Numeric false AverageOfMar_13, AverageOfFeb_16 AverageOfMar_13 ./ AverageOfFeb_16
Standardization with z-score (mean = 1.0327, std = 0.065144)
zsc(sin(AverageOfNov_13)) Numeric false AverageOfNov_13 sin( )
Standardization with z-score (mean = -0.075478, std = 0.73244)
zsc(cos(AverageOfNov_18)) Numeric false AverageOfNov_18 cos( )
Standardization with z-score (mean = -0.13799, std = 0.70592)
zsc(health_uninsured./yearsFromMeanAge) Numeric false health_uninsured, yearsFromMeanAge health_uninsured ./ yearsFromMeanAge
Standardization with z-score (mean = -0.88776, std = 7.7614)

Train a Machine Learning Model

In this example, I’ll use the fitrauto function to automatically test a variety of regression model types and hyperparameter values and select the best one. I use ASHA optimization, as it tends to find good solutions quickly for data sets with many observations, and I choose to use holdout validation, which uses 20% of the dataset for testing. You should play around with these values to see what improvements you can make.
hypParamOptions.Optimizer = “asha”;
hypParamOptions.Holdout = 0.2;
Mdl = fitrauto(augTrainData, “metastatic_diagnosis_period”, “HyperparameterOptimizationOptions”, hypParamOptions)
Learner types to explore: ensemble, svm, tree
Total iterations (MaxObjectiveEvaluations): 255
Total time (MaxTime): Inf|=============================================================================================================================================|
| Iter | Eval | log(1+valLoss)| Time for training | Observed min | Training set | Learner | Hyperparameter: Value |
| | result | | & validation (sec)| validation loss | size | | |
|=============================================================================================================================================|
| 1 | Best | 9.3862 | 1.0312 | 9.3862 | 161 | tree | MinLeafSize: 173 |
| 2 | Best | 9.384 | 2.092 | 9.384 | 161 | ensemble | Method: LSBoost |
| | | | | | | | NumLearningCycles: 232 |
| | | | | | | | MinLeafSize: 1084 |
| 3 | Accept | 38.104 | 0.45806 | 9.384 | 161 | svm | BoxConstraint: 0.011812 |
| | | | | | | | KernelScale: 2.2883 |
| | | | | | | | Epsilon: 38.982 |
| 4 | Best | 9.3825 | 0.28987 | 9.3825 | 161 | tree | MinLeafSize: 140 |
| 5 | Best | 8.9046 | 0.21544 | 8.9046 | 643 | tree | MinLeafSize: 140 |
| 6 | Accept | 9.3853 | 0.10889 | 8.9046 | 161 | tree | MinLeafSize: 5183 |
| 7 | Accept | 8.9281 | 0.10868 | 8.9046 | 161 | tree | MinLeafSize: 45 |
| 8 | Accept | 63.931 | 0.48431 | 8.9046 | 161 | svm | BoxConstraint: 0.0032309 |
| | | | | | | | KernelScale: 4.7109 |
| | | | | | | | Epsilon: 8.986 |
| 9 | Accept | 45.964 | 4.3819 | 8.9046 | 161 | svm | BoxConstraint: 0.12087 |
| | | | | | | | KernelScale: 0.088521 |
| | | | | | | | Epsilon: 0.97865 |
| 10 | Accept | 8.94 | 0.067605 | 8.9046 | 643 | tree | MinLeafSize: 45 |
| 11 | Accept | 71.49 | 4.8778 | 8.9046 | 161 | svm | BoxConstraint: 317.32 |
| | | | | | | | KernelScale: 0.010993 |
| | | | | | | | Epsilon: 19.065 |
| 12 | Accept | 9.3893 | 0.16924 | 8.9046 | 161 | svm | BoxConstraint: 0.11231 |
| | | | | | | | KernelScale: 34.956 |
| | | | | | | | Epsilon: 4417.5 |
| 13 | Accept | 9.3273 | 0.051708 | 8.9046 | 161 | tree | MinLeafSize: 33 |
| 14 | Accept | 9.4163 | 0.061619 | 8.9046 | 161 | svm | BoxConstraint: 0.12262 |
| | | | | | | | KernelScale: 16.877 |
| | | | | | | | Epsilon: 539.11 |
| 15 | Accept | 8.9338 | 0.066245 | 8.9046 | 643 | tree | MinLeafSize: 33 |
| 16 | Accept | 43.881 | 0.082721 | 8.9046 | 161 | svm | BoxConstraint: 49.319 |
| | | | | | | | KernelScale: 4.6223 |
| | | | | | | | Epsilon: 59.775 |
| 17 | Accept | 9.4191 | 0.057352 | 8.9046 | 161 | svm | BoxConstraint: 0.16688 |
| | | | | | | | KernelScale: 0.0023583 |
| | | | | | | | Epsilon: 1744.5 |
| 18 | Accept | 9.393 | 0.058098 | 8.9046 | 161 | svm | BoxConstraint: 0.17661 |
| | | | | | | | KernelScale: 0.0014019 |
| | | | | | | | Epsilon: 872.82 |
| 19 | Accept | 9.2595 | 0.058433 | 8.9046 | 161 | tree | MinLeafSize: 3 |
| 20 | Accept | 9.3043 | 0.085948 | 8.9046 | 643 | tree | MinLeafSize: 3 |
|=============================================================================================================================================|
| Iter | Eval | log(1+valLoss)| Time for training | Observed min | Training set | Learner | Hyperparameter: Value |
| | result | | & validation (sec)| validation loss | size | | |
|=============================================================================================================================================|
| 21 | Best | 8.8832 | 0.080987 | 8.8832 | 2569 | tree | MinLeafSize: 140 |
| 22 | Accept | 9.4095 | 0.061143 | 8.8832 | 161 | svm | BoxConstraint: 0.018037 |
| | | | | | | | KernelScale: 61.209 |
| | | | | | | | Epsilon: 256.27 |
| 23 | Accept | 9.4198 | 0.057961 | 8.8832 | 161 | svm | BoxConstraint: 0.11446 |
| | | | | | | | KernelScale: 15.272 |
| | | | | | | | Epsilon: 197.66 |
| 24 | Accept | 9.1218 | 0.050487 | 8.8832 | 161 | tree | MinLeafSize: 34 |
| 25 | Accept | 9.3875 | 1.7749 | 8.8832 | 161 | ensemble | Method: Bag |
| | | | | | | | NumLearningCycles: 294 |
| | | | | | | | MinLeafSize: 273 |
| 26 | Accept | 8.9284 | 0.11047 | 8.8832 | 643 | tree | MinLeafSize: 34 |
| 27 | Accept | 9.3863 | 0.052435 | 8.8832 | 161 | tree | MinLeafSize: 2719 |
| 28 | Accept | 9.4099 | 0.065684 | 8.8832 | 161 | svm | BoxConstraint: 0.011394 |
| | | | | | | | KernelScale: 0.0018703 |
| | | | | | | | Epsilon: 3.3641 |
| 29 | Accept | 12.819 | 0.5708 | 8.8832 | 161 | svm | BoxConstraint: 28.941 |
| | | | | | | | KernelScale: 6.0836 |
| | | | | | | | Epsilon: 31.22 |
| 30 | Accept | 67.346 | 0.58923 | 8.8832 | 161 | svm | BoxConstraint: 244.94 |
| | | | | | | | KernelScale: 8.5597 |
| | | | | | | | Epsilon: 2.3973 |
| 31 | Accept | 9.3879 | 1.4179 | 8.8832 | 643 | ensemble | Method: LSBoost |
| | | | | | | | NumLearningCycles: 232 |
| | | | | | | | MinLeafSize: 1084 |
| 32 | Accept | 65.415 | 0.091055 | 8.8832 | 161 | svm | BoxConstraint: 1.2417 |
| | | | | | | | KernelScale: 0.0050643 |
| | | | | | | | Epsilon: 76.681 |
| 33 | Accept | 9.4225 | 0.060363 | 8.8832 | 161 | svm | BoxConstraint: 0.0084308 |
| | | | | | | | KernelScale: 833.3 |
| | | | | | | | Epsilon: 730.67 |
| 34 | Accept | 8.9623 | 2.1224 | 8.8832 | 161 | ensemble | Method: Bag |
| | | | | | | | NumLearningCycles: 285 |
| | | | | | | | MinLeafSize: 12 |
| 35 | Accept | 50.056 | 0.56976 | 8.8832 | 161 | svm | BoxConstraint: 0.72025 |
| | | | | | | | KernelScale: 9.8778 |
| | | | | | | | Epsilon: 6.4438 |
| 36 | Best | 8.8771 | 2.5786 | 8.8771 | 643 | ensemble | Method: Bag |
| | | | | | | | NumLearningCycles: 285 |
| | | | | | | | MinLeafSize: 12 |
| 37 | Accept | 9.0976 | 0.084623 | 8.8771 | 161 | tree | MinLeafSize: 8 |
| 38 | Accept | 9.3819 | 1.4843 | 8.8771 | 161 | ensemble | Method: Bag |
| | | | | | | | NumLearningCycles: 294 |
| | | | | | | | MinLeafSize: 1255 |
| 39 | Accept | 8.9822 | 1.5021 | 8.8771 | 161 | ensemble | Method: Bag |
| | | | | | | | NumLearningCycles: 208 |
| | | | | | | | MinLeafSize: 16 |
| 40 | Accept | 45.349 | 0.50465 | 8.8771 | 161 | svm | BoxConstraint: 0.0031861 |
| | | | | | | | KernelScale: 1.1929 |
| | | | | | | | Epsilon: 3.846 |
|=============================================================================================================================================|
| Iter | Eval | log(1+valLoss)| Time for training | Observed min | Training set | Learner | Hyperparameter: Value |
| | result | | & validation (sec)| validation loss | size | | |
|=============================================================================================================================================|
| 41 | Best | 8.8726 | 1.7837 | 8.8726 | 643 | ensemble | Method: Bag |
| | | | | | | | NumLearningCycles: 208 |
| | | | | | | | MinLeafSize: 16 |
| 42 | Best | 8.8377 | 2.8179 | 8.8377 | 2569 | ensemble | Method: Bag |
| | | | | | | | NumLearningCycles: 208 |
| | | | | | | | MinLeafSize: 16 |
| 43 | Accept | 9.3834 | 1.4848 | 8.8377 | 161 | ensemble | Method: LSBoost |
| | | | | | | | NumLearningCycles: 269 |
| | | | | | | | MinLeafSize: 101 |
| 44 | Accept | 9.4026 | 0.075617 | 8.8377 | 161 | svm | BoxConstraint: 120.1 |
| | | | | | | | KernelScale: 1.5209 |
| | | | | | | | Epsilon: 1610.5 |
| 45 | Accept | 8.9233 | 1.5883 | 8.8377 | 161 | ensemble | Method: Bag |
| | | | | | | | NumLearningCycles: 224 |
| | | | | | | | MinLeafSize: 4 |
| 46 | Accept | 34.178 | 4.802 | 8.8377 | 161 | svm | BoxConstraint: 663.55 |
| | | | | | | | KernelScale: 0.045175 |
| | | | | | | | Epsilon: 3.6348 |
| 47 | Accept | 8.8728 | 1.9803 | 8.8377 | 643 | ensemble | Method: Bag |
| | | | | | | | NumLearningCycles: 224 |
| | | | | | | | MinLeafSize: 4 |
| 48 | Accept | 16.005 | 2.1964 | 8.8377 | 161 | svm | BoxConstraint: 41.536 |
| | | | | | | | KernelScale: 0.13288 |
| | | | | | | | Epsilon: 0.76209 |
| 49 | Accept | 9.5967 | 5.0388 | 8.8377 | 161 | svm | BoxConstraint: 434.82 |
| | | | | | | | KernelScale: 0.31522 |
| | | | | | | | Epsilon: 5.0709 |
| 50 | Accept | 9.4046 | 0.056141 | 8.8377 | 161 | svm | BoxConstraint: 0.0019764 |
| | | | | | | | KernelScale: 0.98483 |
| | | | | | | | Epsilon: 304.63 |
| 51 | Accept | 35.523 | 4.2078 | 8.8377 | 161 | svm | BoxConstraint: 0.017662 |
| | | | | | | | KernelScale: 0.0065272 |
| | | | | | | | Epsilon: 1.7329 |
| 52 | Accept | 9.1215 | 0.11814 | 8.8377 | 643 | tree | MinLeafSize: 8 |
| 53 | Accept | 9.3878 | 1.4928 | 8.8377 | 161 | ensemble | Method: LSBoost |
| | | | | | | | NumLearningCycles: 264 |
| | | | | | | | MinLeafSize: 2956 |
| 54 | Accept | 9.3846 | 0.054412 | 8.8377 | 161 | tree | MinLeafSize: 125 |
| 55 | Accept | 9.0298 | 0.053416 | 8.8377 | 161 | tree | MinLeafSize: 34 |
| 56 | Accept | 9.4066 | 0.067662 | 8.8377 | 161 | svm | BoxConstraint: 0.21675 |
| | | | | | | | KernelScale: 79.17 |
| | | | | | | | Epsilon: 764.21 |
| 57 | Accept | 8.942 | 0.07282 | 8.8377 | 643 | tree | MinLeafSize: 34 |
| 58 | Accept | 9.3883 | 1.3873 | 8.8377 | 161 | ensemble | Method: Bag |
| | | | | | | | NumLearningCycles: 267 |
| | | | | | | | MinLeafSize: 3998 |
| 59 | Accept | 9.1155 | 1.9223 | 8.8377 | 161 | ensemble | Method: LSBoost |
| | | | | | | | NumLearningCycles: 255 |
| | | | | | | | MinLeafSize: 7 |
| 60 | Accept | 11.03 | 0.093069 | 8.8377 | 161 | svm | BoxConstraint: 0.34881 |
| | | | | | | | KernelScale: 1.0691 |
| | | | | | | | Epsilon: 61.589 |
|=============================================================================================================================================|
| Iter | Eval | log(1+valLoss)| Time for training | Observed min | Training set | Learner | Hyperparameter: Value |
| | result | | & validation (sec)| validation loss | size | | |
|=============================================================================================================================================|
| 61 | Accept | 20.181 | 0.61277 | 8.8377 | 161 | svm | BoxConstraint: 82.516 |
| | | | | | | | KernelScale: 9.0767 |
| | | | | | | | Epsilon: 1.705 |
| 62 | Accept | 8.98 | 3.2622 | 8.8377 | 643 | ensemble | Method: LSBoost |
| | | | | | | | NumLearningCycles: 255 |
| | | | | | | | MinLeafSize: 7 |
| 63 | Accept | 8.8565 | 3.0996 | 8.8377 | 2569 | ensemble | Method: Bag |
| | | | | | | | NumLearningCycles: 224 |
| | | | | | | | MinLeafSize: 4 |
| 64 | Accept | 9.3866 | 1.0202 | 8.8377 | 161 | ensemble | Method: Bag |
| | | | | | | | NumLearningCycles: 207 |
| | | | | | | | MinLeafSize: 6286 |
| 65 | Accept | 31.849 | 0.56723 | 8.8377 | 161 | svm | BoxConstraint: 164.7 |
| | | | | | | | KernelScale: 977.44 |
| | | | | | | | Epsilon: 4.0873 |
| 66 | Accept | 9.3456 | 0.08663 | 8.8377 | 161 | tree | MinLeafSize: 3 |
| 67 | Accept | 9.3898 | 0.046713 | 8.8377 | 161 | tree | MinLeafSize: 568 |
| 68 | Accept | 9.3241 | 0.089116 | 8.8377 | 643 | tree | MinLeafSize: 3 |
| 69 | Accept | 25.765 | 0.62032 | 8.8377 | 161 | svm | BoxConstraint: 0.12804 |
| | | | | | | | KernelScale: 2.8982 |
| | | | | | | | Epsilon: 0.26435 |
| 70 | Accept | 9.392 | 0.061827 | 8.8377 | 161 | svm | BoxConstraint: 0.0036781 |
| | | | | | | | KernelScale: 135.24 |
| | | | | | | | Epsilon: 10235 |
| 71 | Accept | 65.542 | 4.5555 | 8.8377 | 161 | svm | BoxConstraint: 429.64 |
| | | | | | | | KernelScale: 0.1032 |
| | | | | | | | Epsilon: 140.83 |
| 72 | Accept | 9.6253 | 2.2298 | 8.8377 | 161 | svm | BoxConstraint: 28.772 |
| | | | | | | | KernelScale: 0.1677 |
| | | | | | | | Epsilon: 0.1355 |
| 73 | Accept | 9.3874 | 1.5589 | 8.8377 | 643 | ensemble | Method: Bag |
| | | | | | | | NumLearningCycles: 294 |
| | | | | | | | MinLeafSize: 1255 |
| 74 | Accept | 51.726 | 4.4621 | 8.8377 | 161 | svm | BoxConstraint: 210.52 |
| | | | | | | | KernelScale: 0.03399 |
| | | | | | | | Epsilon: 143.6 |
| 75 | Accept | 8.9997 | 2.0089 | 8.8377 | 161 | ensemble | Method: Bag |
| | | | | | | | NumLearningCycles: 281 |
| | | | | | | | MinLeafSize: 4 |
| 76 | Accept | 9.4831 | 4.4187 | 8.8377 | 161 | svm | BoxConstraint: 12.41 |
| | | | | | | | KernelScale: 0.046831 |
| | | | | | | | Epsilon: 0.18991 |
| 77 | Accept | 9.2437 | 0.063799 | 8.8377 | 161 | tree | MinLeafSize: 65 |
| 78 | Accept | 8.8737 | 2.5522 | 8.8377 | 643 | ensemble | Method: Bag |
| | | | | | | | NumLearningCycles: 281 |
| | | | | | | | MinLeafSize: 4 |
| 79 | Accept | 9.3952 | 1.5512 | 8.8377 | 161 | ensemble | Method: LSBoost |
| | | | | | | | NumLearningCycles: 274 |
| | | | | | | | MinLeafSize: 2137 |
| 80 | Accept | 9.3839 | 1.2513 | 8.8377 | 161 | ensemble | Method: LSBoost |
| | | | | | | | NumLearningCycles: 225 |
| | | | | | | | MinLeafSize: 4427 |
|=============================================================================================================================================|
| Iter | Eval | log(1+valLoss)| Time for training | Observed min | Training set | Learner | Hyperparameter: Value |
| | result | | & validation (sec)| validation loss | size | | |
|=============================================================================================================================================|
| 81 | Accept | 9.3187 | 0.065288 | 8.8377 | 161 | tree | MinLeafSize: 1 |
| 82 | Accept | 73.182 | 0.65686 | 8.8377 | 161 | svm | BoxConstraint: 8.1923 |
| | | | | | | | KernelScale: 49.754 |
| | | | | | | | Epsilon: 26.414 |
| 83 | Accept | 8.9351 | 0.062065 | 8.8377 | 643 | tree | MinLeafSize: 65 |
| 84 | Accept | 8.8466 | 3.9785 | 8.8377 | 2569 | ensemble | Method: Bag |
| | | | | | | | NumLearningCycles: 281 |
| | | | | | | | MinLeafSize: 4 |
| 85 | Best | 8.8186 | 4.6234 | 8.8186 | 10276 | ensemble | Method: Bag |
| | | | | | | | NumLearningCycles: 208 |
| | | | | | | | MinLeafSize: 16 |
| 86 | Accept | 49.608 | 4.8881 | 8.8186 | 161 | svm | BoxConstraint: 0.0038653 |
| | | | | | | | KernelScale: 0.084163 |
| | | | | | | | Epsilon: 0.17521 |
| 87 | Accept | 9.3834 | 0.07619 | 8.8186 | 161 | tree | MinLeafSize: 4107 |
| 88 | Accept | 26.492 | 0.67516 | 8.8186 | 161 | svm | BoxConstraint: 2.5636 |
| | | | | | | | KernelScale: 26.944 |
| | | | | | | | Epsilon: 6.7933 |
| 89 | Accept | 9.3862 | 0.058577 | 8.8186 | 161 | svm | BoxConstraint: 0.0046431 |
| | | | | | | | KernelScale: 0.0018285 |
| | | | | | | | Epsilon: 912.14 |
| 90 | Accept | 9.3978 | 0.1019 | 8.8186 | 643 | tree | MinLeafSize: 1 |
| 91 | Accept | 9.183 | 0.059411 | 8.8186 | 161 | tree | MinLeafSize: 7 |
| 92 | Accept | 9.4018 | 0.065758 | 8.8186 | 161 | svm | BoxConstraint: 0.011254 |
| | | | | | | | KernelScale: 1.6707 |
| | | | | | | | Epsilon: 1282.9 |
| 93 | Accept | 9.4118 | 1.3933 | 8.8186 | 161 | ensemble | Method: LSBoost |
| | | | | | | | NumLearningCycles: 246 |
| | | | | | | | MinLeafSize: 5704 |
| 94 | Accept | 50.857 | 4.4175 | 8.8186 | 161 | svm | BoxConstraint: 184.91 |
| | | | | | | | KernelScale: 300 |
| | | | | | | | Epsilon: 9.9176 |
| 95 | Accept | 9.2085 | 0.087503 | 8.8186 | 643 | tree | MinLeafSize: 7 |
| 96 | Accept | 9.4498 | 4.023 | 8.8186 | 161 | svm | BoxConstraint: 0.0021245 |
| | | | | | | | KernelScale: 103.57 |
| | | | | | | | Epsilon: 59.501 |
| 97 | Accept | 9.3829 | 0.0519 | 8.8186 | 161 | tree | MinLeafSize: 225 |
| 98 | Accept | 9.4148 | 0.64092 | 8.8186 | 161 | svm | BoxConstraint: 1.1581 |
| | | | | | | | KernelScale: 375.69 |
| | | | | | | | Epsilon: 1.2079 |
| 99 | Accept | 9.4039 | 0.057192 | 8.8186 | 161 | svm | BoxConstraint: 0.0046686 |
| | | | | | | | KernelScale: 0.0075742 |
| | | | | | | | Epsilon: 6458.5 |
| 100 | Accept | 9.2181 | 0.05773 | 8.8186 | 643 | tree | MinLeafSize: 225 |
|=============================================================================================================================================|
| Iter | Eval | log(1+valLoss)| Time for training | Observed min | Training set | Learner | Hyperparameter: Value |
| | result | | & validation (sec)| validation loss | size | | |
|=============================================================================================================================================|
| 101 | Accept | 9.3843 | 1.2718 | 8.8186 | 161 | ensemble | Method: Bag |
| | | | | | | | NumLearningCycles: 253 |
| | | | | | | | MinLeafSize: 544 |
| 102 | Accept | 9.3807 | 1.3051 | 8.8186 | 161 | ensemble | Method: LSBoost |
| | | | | | | | NumLearningCycles: 228 |
| | | | | | | | MinLeafSize: 100 |
| 103 | Accept | 21.2 | 0.66422 | 8.8186 | 161 | svm | BoxConstraint: 0.0091956 |
| | | | | | | | KernelScale: 6.027 |
| | | | | | | | Epsilon: 0.19667 |
| 104 | Accept | 10.175 | 0.079159 | 8.8186 | 161 | svm | BoxConstraint: 0.10113 |
| | | | | | | | KernelScale: 72.6 |
| | | | | | | | Epsilon: 70.924 |
| 105 | Accept | 8.9431 | 3.0941 | 8.8186 | 643 | ensemble | Method: LSBoost |
| | | | | | | | NumLearningCycles: 228 |
| | | | | | | | MinLeafSize: 100 |
| 106 | Accept | 8.8463 | 4.1395 | 8.8186 | 2569 | ensemble | Method: Bag |
| | | | | | | | NumLearningCycles: 285 |
| | | | | | | | MinLeafSize: 12 |
| 107 | Accept | 12.042 | 4.2272 | 8.8186 | 161 | svm | BoxConstraint: 0.0062352 |
| | | | | | | | KernelScale: 0.1105 |
| | | | | | | | Epsilon: 0.54085 |
| 108 | Accept | 9.3848 | 1.2747 | 8.8186 | 161 | ensemble | Method: LSBoost |
| | | | | | | | NumLearningCycles: 218 |
| | | | | | | | MinLeafSize: 840 |
| 109 | Accept | 9.3934 | 0.058925 | 8.8186 | 161 | svm | BoxConstraint: 5.6969 |
| | | | | | | | KernelScale: 0.023262 |
| | | | | | | | Epsilon: 7846.5 |
| 110 | Accept | 9.0115 | 0.073708 | 8.8186 | 161 | tree | MinLeafSize: 37 |
| 111 | Accept | 8.9938 | 0.060299 | 8.8186 | 643 | tree | MinLeafSize: 37 |
| 112 | Accept | 9.391 | 0.048814 | 8.8186 | 161 | tree | MinLeafSize: 1820 |
| 113 | Accept | 9.3873 | 0.074416 | 8.8186 | 161 | svm | BoxConstraint: 10.972 |
| | | | | | | | KernelScale: 0.0019127 |
| | | | | | | | Epsilon: 2.2406 |
| 114 | Accept | 8.9535 | 1.9056 | 8.8186 | 161 | ensemble | Method: Bag |
| | | | | | | | NumLearningCycles: 266 |
| | | | | | | | MinLeafSize: 16 |
| 115 | Accept | 9.397 | 1.0038 | 8.8186 | 161 | ensemble | Method: Bag |
| | | | | | | | NumLearningCycles: 201 |
| | | | | | | | MinLeafSize: 474 |
| 116 | Accept | 8.8859 | 2.4423 | 8.8186 | 643 | ensemble | Method: Bag |
| | | | | | | | NumLearningCycles: 266 |
| | | | | | | | MinLeafSize: 16 |
| 117 | Accept | 9.3736 | 0.062757 | 8.8186 | 161 | tree | MinLeafSize: 4 |
| 118 | Accept | 9.3833 | 1.6432 | 8.8186 | 161 | ensemble | Method: LSBoost |
| | | | | | | | NumLearningCycles: 286 |
| | | | | | | | MinLeafSize: 415 |
| 119 | Accept | 9.4034 | 0.052013 | 8.8186 | 161 | tree | MinLeafSize: 163 |
| 120 | Accept | 65.505 | 4.21 | 8.8186 | 161 | svm | BoxConstraint: 126.42 |
| | | | | | | | KernelScale: 0.00956 |
| | | | | | | | Epsilon: 0.77659 |
|=============================================================================================================================================|
| Iter | Eval | log(1+valLoss)| Time for training | Observed min | Training set | Learner | Hyperparameter: Value |
| | result | | & validation (sec)| validation loss | size | | |
|=============================================================================================================================================|
| 121 | Accept | 9.3102 | 0.098523 | 8.8186 | 643 | tree | MinLeafSize: 4 |
| 122 | Accept | 15.235 | 3.8075 | 8.8186 | 161 | svm | BoxConstraint: 0.042479 |
| | | | | | | | KernelScale: 0.054739 |
| | | | | | | | Epsilon: 126.07 |
| 123 | Accept | 9.3993 | 1.2692 | 8.8186 | 161 | ensemble | Method: LSBoost |
| | | | | | | | NumLearningCycles: 220 |
| | | | | | | | MinLeafSize: 305 |
| 124 | Accept | 9.3933 | 0.047521 | 8.8186 | 161 | tree | MinLeafSize: 181 |
| 125 | Accept | 9.4005 | 0.064158 | 8.8186 | 161 | svm | BoxConstraint: 0.75184 |
| | | | | | | | KernelScale: 103.16 |
| | | | | | | | Epsilon: 7561.9 |
| 126 | Accept | 9.3843 | 1.5854 | 8.8186 | 643 | ensemble | Method: LSBoost |
| | | | | | | | NumLearningCycles: 286 |
| | | | | | | | MinLeafSize: 415 |
| 127 | Accept | 8.8356 | 3.6654 | 8.8186 | 2569 | ensemble | Method: Bag |
| | | | | | | | NumLearningCycles: 266 |
| | | | | | | | MinLeafSize: 16 |
| 128 | Accept | 9.3867 | 0.063994 | 8.8186 | 161 | tree | MinLeafSize: 5651 |
| 129 | Accept | 13.063 | 2.1824 | 8.8186 | 161 | svm | BoxConstraint: 42.956 |
| | | | | | | | KernelScale: 0.15102 |
| | | | | | | | Epsilon: 150.18 |
| 130 | Accept | 9.6326 | 0.60577 | 8.8186 | 161 | svm | BoxConstraint: 0.001179 |
| | | | | | | | KernelScale: 210.03 |
| | | | | | | | Epsilon: 0.64499 |
| 131 | Accept | 9.3849 | 1.0936 | 8.8186 | 161 | ensemble | Method: Bag |
| | | | | | | | NumLearningCycles: 207 |
| | | | | | | | MinLeafSize: 3437 |
| 132 | Accept | 9.3808 | 0.0571 | 8.8186 | 643 | tree | MinLeafSize: 4107 |
| 133 | Accept | 36.663 | 0.084854 | 8.8186 | 161 | svm | BoxConstraint: 0.0013618 |
| | | | | | | | KernelScale: 5.0765 |
| | | | | | | | Epsilon: 127.19 |
| 134 | Accept | 16.268 | 3.842 | 8.8186 | 161 | svm | BoxConstraint: 0.0064316 |
| | | | | | | | KernelScale: 0.19009 |
| | | | | | | | Epsilon: 1.1912 |
| 135 | Accept | 9.5749 | 0.6606 | 8.8186 | 161 | svm | BoxConstraint: 0.089516 |
| | | | | | | | KernelScale: 127.63 |
| | | | | | | | Epsilon: 1.7522 |
| 136 | Accept | 9.3917 | 1.1714 | 8.8186 | 161 | ensemble | Method: Bag |
| | | | | | | | NumLearningCycles: 234 |
| | | | | | | | MinLeafSize: 5148 |
| 137 | Accept | 8.9512 | 2.9923 | 8.8186 | 643 | ensemble | Method: LSBoost |
| | | | | | | | NumLearningCycles: 269 |
| | | | | | | | MinLeafSize: 101 |
| 138 | Accept | 9.1052 | 0.0628 | 8.8186 | 161 | tree | MinLeafSize: 7 |
| 139 | Accept | 9.398 | 0.081349 | 8.8186 | 161 | svm | BoxConstraint: 0.016058 |
| | | | | | | | KernelScale: 183.58 |
| | | | | | | | Epsilon: 503.13 |
| 140 | Accept | 9.4164 | 0.056624 | 8.8186 | 161 | tree | MinLeafSize: 1758 |
|=============================================================================================================================================|
| Iter | Eval | log(1+valLoss)| Time for training | Observed min | Training set | Learner | Hyperparameter: Value |
| | result | | & validation (sec)| validation loss | size | | |
|=============================================================================================================================================|
| 141 | Accept | 9.4052 | 0.061562 | 8.8186 | 161 | svm | BoxConstraint: 0.023222 |
| | | | | | | | KernelScale: 76.906 |
| | | | | | | | Epsilon: 8814 |
| 142 | Accept | 9.1784 | 0.082115 | 8.8186 | 643 | tree | MinLeafSize: 7 |
| 143 | Accept | 9.2477 | 2.0155 | 8.8186 | 161 | ensemble | Method: LSBoost |
| | | | | | | | NumLearningCycles: 272 |
| | | | | | | | MinLeafSize: 1 |
| 144 | Accept | 9.4018 | 0.06487 | 8.8186 | 161 | svm | BoxConstraint: 626.86 |
| | | | | | | | KernelScale: 0.43541 |
| | | | | | | | Epsilon: 1627.4 |
| 145 | Accept | 9.3975 | 0.058275 | 8.8186 | 161 | svm | BoxConstraint: 0.0028588 |
| | | | | | | | KernelScale: 209.66 |
| | | | | | | | Epsilon: 4232.3 |
| 146 | Accept | 9.521 | 0.6356 | 8.8186 | 161 | svm | BoxConstraint: 0.083407 |
| | | | | | | | KernelScale: 312.85 |
| | | | | | | | Epsilon: 0.20668 |
| 147 | Accept | 8.9708 | 3.2479 | 8.8186 | 643 | ensemble | Method: LSBoost |
| | | | | | | | NumLearningCycles: 272 |
| | | | | | | | MinLeafSize: 1 |
| 148 | Accept | 8.9616 | 0.10093 | 8.8186 | 2569 | tree | MinLeafSize: 34 |
| 149 | Accept | 15.713 | 4.9592 | 8.8186 | 161 | svm | BoxConstraint: 0.019721 |
| | | | | | | | KernelScale: 0.006631 |
| | | | | | | | Epsilon: 0.81317 |
| 150 | Accept | 61.246 | 2.2315 | 8.8186 | 161 | svm | BoxConstraint: 0.10628 |
| | | | | | | | KernelScale: 0.26584 |
| | | | | | | | Epsilon: 56.177 |
| 151 | Accept | 9.3827 | 1.118 | 8.8186 | 161 | ensemble | Method: Bag |
| | | | | | | | NumLearningCycles: 214 |
| | | | | | | | MinLeafSize: 314 |
| 152 | Accept | 9.776 | 4.5082 | 8.8186 | 161 | svm | BoxConstraint: 0.0013601 |
| | | | | | | | KernelScale: 0.046336 |
| | | | | | | | Epsilon: 5.0766 |
| 153 | Accept | 9.3125 | 1.2559 | 8.8186 | 643 | ensemble | Method: Bag |
| | | | | | | | NumLearningCycles: 214 |
| | | | | | | | MinLeafSize: 314 |
| 154 | Accept | 9.397 | 1.4413 | 8.8186 | 161 | ensemble | Method: Bag |
| | | | | | | | NumLearningCycles: 273 |
| | | | | | | | MinLeafSize: 594 |
| 155 | Accept | 9.3904 | 0.067118 | 8.8186 | 161 | svm | BoxConstraint: 0.0014004 |
| | | | | | | | KernelScale: 41.954 |
| | | | | | | | Epsilon: 6132.6 |
| 156 | Accept | 11.159 | 0.074313 | 8.8186 | 161 | svm | BoxConstraint: 0.013397 |
| | | | | | | | KernelScale: 9.1715 |
| | | | | | | | Epsilon: 81.019 |
| 157 | Accept | 22.357 | 4.3335 | 8.8186 | 161 | svm | BoxConstraint: 0.41907 |
| | | | | | | | KernelScale: 0.010689 |
| | | | | | | | Epsilon: 13.091 |
| 158 | Accept | 9.3881 | 1.2611 | 8.8186 | 643 | ensemble | Method: LSBoost |
| | | | | | | | NumLearningCycles: 225 |
| | | | | | | | MinLeafSize: 4427 |
| 159 | Accept | 9.4028 | 0.067058 | 8.8186 | 161 | svm | BoxConstraint: 0.036022 |
| | | | | | | | KernelScale: 8.618 |
| | | | | | | | Epsilon: 12523 |
| 160 | Accept | 9.5619 | 4.8535 | 8.8186 | 161 | svm | BoxConstraint: 5.6235 |
| | | | | | | | KernelScale: 0.020708 |
| | | | | | | | Epsilon: 0.15719 |
|=============================================================================================================================================|
| Iter | Eval | log(1+valLoss)| Time for training | Observed min | Training set | Learner | Hyperparameter: Value |
| | result | | & validation (sec)| validation loss | size | | |
|=============================================================================================================================================|
| 161 | Accept | 9.385 | 0.070467 | 8.8186 | 161 | tree | MinLeafSize: 2083 |
| 162 | Accept | 9.4042 | 0.061121 | 8.8186 | 161 | svm | BoxConstraint: 212.83 |
| | | | | | | | KernelScale: 0.0011315 |
| | | | | | | | Epsilon: 4.8239 |
| 163 | Accept | 9.3832 | 1.3395 | 8.8186 | 643 | ensemble | Method: Bag |
| | | | | | | | NumLearningCycles: 253 |
| | | | | | | | MinLeafSize: 544 |
| 164 | Accept | 9.4427 | 0.062918 | 8.8186 | 161 | svm | BoxConstraint: 40.982 |
| | | | | | | | KernelScale: 51.518 |
| | | | | | | | Epsilon: 276.22 |
| 165 | Accept | 9.3838 | 0.052175 | 8.8186 | 161 | tree | MinLeafSize: 259 |
| 166 | Accept | 9.3923 | 0.044845 | 8.8186 | 161 | tree | MinLeafSize: 174 |
| 167 | Accept | 9.3843 | 0.064853 | 8.8186 | 161 | svm | BoxConstraint: 2.4613 |
| | | | | | | | KernelScale: 0.0059067 |
| | | | | | | | Epsilon: 2318.5 |
| 168 | Accept | 9.2331 | 0.058123 | 8.8186 | 643 | tree | MinLeafSize: 259 |
| 169 | Accept | 8.9465 | 0.09373 | 8.8186 | 2569 | tree | MinLeafSize: 33 |
| 170 | Accept | 8.8205 | 5.9209 | 8.8186 | 10276 | ensemble | Method: Bag |
| | | | | | | | NumLearningCycles: 266 |
| | | | | | | | MinLeafSize: 16 |
| 171 | Accept | 9.0308 | 0.055452 | 8.8186 | 161 | tree | MinLeafSize: 25 |
| 172 | Accept | 9.4106 | 0.064019 | 8.8186 | 161 | svm | BoxConstraint: 5.1299 |
| | | | | | | | KernelScale: 0.0049434 |
| | | | | | | | Epsilon: 2964.7 |
| 173 | Accept | 8.9875 | 0.049886 | 8.8186 | 161 | tree | MinLeafSize: 17 |
| 174 | Accept | 9.6815 | 0.068647 | 8.8186 | 161 | svm | BoxConstraint: 0.012521 |
| | | | | | | | KernelScale: 5.8218 |
| | | | | | | | Epsilon: 158.28 |
| 175 | Accept | 9.0889 | 0.080584 | 8.8186 | 643 | tree | MinLeafSize: 17 |
| 176 | Accept | 9.0743 | 0.051929 | 8.8186 | 161 | tree | MinLeafSize: 9 |
| 177 | Accept | 50.143 | 0.53578 | 8.8186 | 161 | svm | BoxConstraint: 0.0025675 |
| | | | | | | | KernelScale: 2.9123 |
| | | | | | | | Epsilon: 2.7823 |
| 178 | Accept | 11.317 | 0.65696 | 8.8186 | 161 | svm | BoxConstraint: 0.0013653 |
| | | | | | | | KernelScale: 0.72963 |
| | | | | | | | Epsilon: 1.9059 |
| 179 | Accept | 8.9881 | 1.9317 | 8.8186 | 161 | ensemble | Method: Bag |
| | | | | | | | NumLearningCycles: 273 |
| | | | | | | | MinLeafSize: 4 |
| 180 | Accept | 8.8611 | 2.3584 | 8.8186 | 643 | ensemble | Method: Bag |
| | | | | | | | NumLearningCycles: 273 |
| | | | | | | | MinLeafSize: 4 |
|=============================================================================================================================================|
| Iter | Eval | log(1+valLoss)| Time for training | Observed min | Training set | Learner | Hyperparameter: Value |
| | result | | & validation (sec)| validation loss | size | | |
|=============================================================================================================================================|
| 181 | Accept | 17.128 | 0.082904 | 8.8186 | 161 | svm | BoxConstraint: 882.02 |
| | | | | | | | KernelScale: 3.6447 |
| | | | | | | | Epsilon: 40.81 |
| 182 | Accept | 9.3873 | 0.059449 | 8.8186 | 161 | svm | BoxConstraint: 0.036152 |
| | | | | | | | KernelScale: 128.56 |
| | | | | | | | Epsilon: 676.9 |
| 183 | Accept | 14.295 | 0.59637 | 8.8186 | 161 | svm | BoxConstraint: 0.036148 |
| | | | | | | | KernelScale: 5.6466 |
| | | | | | | | Epsilon: 3.4635 |
| 184 | Accept | 9.3841 | 1.4813 | 8.8186 | 161 | ensemble | Method: Bag |
| | | | | | | | NumLearningCycles: 299 |
| | | | | | | | MinLeafSize: 1158 |
| 185 | Accept | 8.9781 | 0.071583 | 8.8186 | 643 | tree | MinLeafSize: 25 |
| 186 | Accept | 9.4077 | 0.06309 | 8.8186 | 161 | svm | BoxConstraint: 349.21 |
| | | | | | | | KernelScale: 0.042446 |
| | | | | | | | Epsilon: 9446.5 |
| 187 | Accept | 63.652 | 0.51835 | 8.8186 | 161 | svm | BoxConstraint: 55.367 |
| | | | | | | | KernelScale: 2.9867 |
| | | | | | | | Epsilon: 0.37288 |
| 188 | Accept | 9.4193 | 0.057529 | 8.8186 | 161 | svm | BoxConstraint: 22.899 |
| | | | | | | | KernelScale: 0.0048942 |
| | | | | | | | Epsilon: 483.9 |
| 189 | Accept | 36.23 | 0.50743 | 8.8186 | 161 | svm | BoxConstraint: 0.5866 |
| | | | | | | | KernelScale: 9.2803 |
| | | | | | | | Epsilon: 21.876 |
| 190 | Accept | 9.1316 | 0.079127 | 8.8186 | 643 | tree | MinLeafSize: 9 |
| 191 | Accept | 8.84 | 3.7635 | 8.8186 | 2569 | ensemble | Method: Bag |
| | | | | | | | NumLearningCycles: 273 |
| | | | | | | | MinLeafSize: 4 |
| 192 | Accept | 9.3821 | 1.563 | 8.8186 | 161 | ensemble | Method: LSBoost |
| | | | | | | | NumLearningCycles: 286 |
| | | | | | | | MinLeafSize: 584 |
| 193 | Accept | 8.9676 | 1.8838 | 8.8186 | 161 | ensemble | Method: LSBoost |
| | | | | | | | NumLearningCycles: 267 |
| | | | | | | | MinLeafSize: 19 |
| 194 | Accept | 9.1405 | 0.069161 | 8.8186 | 161 | tree | MinLeafSize: 7 |
| 195 | Accept | 9.4212 | 0.09857 | 8.8186 | 161 | svm | BoxConstraint: 50.571 |
| | | | | | | | KernelScale: 0.024255 |
| | | | | | | | Epsilon: 7431.5 |
| 196 | Accept | 8.9856 | 3.4297 | 8.8186 | 643 | ensemble | Method: LSBoost |
| | | | | | | | NumLearningCycles: 267 |
| | | | | | | | MinLeafSize: 19 |
| 197 | Accept | 9.0698 | 1.7118 | 8.8186 | 161 | ensemble | Method: LSBoost |
| | | | | | | | NumLearningCycles: 237 |
| | | | | | | | MinLeafSize: 3 |
| 198 | Accept | 9.3841 | 1.1616 | 8.8186 | 161 | ensemble | Method: Bag |
| | | | | | | | NumLearningCycles: 219 |
| | | | | | | | MinLeafSize: 135 |
| 199 | Accept | 9.3855 | 1.2281 | 8.8186 | 161 | ensemble | Method: LSBoost |
| | | | | | | | NumLearningCycles: 220 |
| | | | | | | | MinLeafSize: 1640 |
| 200 | Accept | 9.3889 | 0.066239 | 8.8186 | 161 | svm | BoxConstraint: 0.79242 |
| | | | | | | | KernelScale: 0.02442 |
| | | | | | | | Epsilon: 3825.6 |
|=============================================================================================================================================|
| Iter | Eval | log(1+valLoss)| Time for training | Observed min | Training set | Learner | Hyperparameter: Value |
| | result | | & validation (sec)| validation loss | size | | |
|=============================================================================================================================================|
| 201 | Accept | 8.9793 | 3.1501 | 8.8186 | 643 | ensemble | Method: LSBoost |
| | | | | | | | NumLearningCycles: 237 |
| | | | | | | | MinLeafSize: 3 |
| 202 | Accept | 9.4226 | 0.058343 | 8.8186 | 161 | svm | BoxConstraint: 0.0095052 |
| | | | | | | | KernelScale: 41.559 |
| | | | | | | | Epsilon: 1783.5 |
| 203 | Accept | 10.347 | 4.2165 | 8.8186 | 161 | svm | BoxConstraint: 131.23 |
| | | | | | | | KernelScale: 0.072051 |
| | | | | | | | Epsilon: 7.455 |
| 204 | Accept | 9.3921 | 0.065431 | 8.8186 | 161 | tree | MinLeafSize: 2331 |
| 205 | Accept | 9.3958 | 0.066415 | 8.8186 | 161 | svm | BoxConstraint: 0.0016799 |
| | | | | | | | KernelScale: 425.35 |
| | | | | | | | Epsilon: 258.47 |
| 206 | Accept | 9.1869 | 0.07482 | 8.8186 | 643 | tree | MinLeafSize: 7 |
| 207 | Accept | 9.3103 | 0.046643 | 8.8186 | 161 | tree | MinLeafSize: 58 |
| 208 | Accept | 9.3878 | 0.04433 | 8.8186 | 161 | tree | MinLeafSize: 1330 |
| 209 | Accept | 9.4127 | 0.062485 | 8.8186 | 161 | svm | BoxConstraint: 0.33434 |
| | | | | | | | KernelScale: 0.015733 |
| | | | | | | | Epsilon: 2799.4 |
| 210 | Accept | 36.153 | 0.62403 | 8.8186 | 161 | svm | BoxConstraint: 0.1378 |
| | | | | | | | KernelScale: 7.1397 |
| | | | | | | | Epsilon: 15.041 |
| 211 | Accept | 8.9388 | 0.059248 | 8.8186 | 643 | tree | MinLeafSize: 58 |
| 212 | Accept | 8.9134 | 0.090664 | 8.8186 | 2569 | tree | MinLeafSize: 65 |
| 213 | Accept | 9.3964 | 0.061733 | 8.8186 | 161 | svm | BoxConstraint: 0.26343 |
| | | | | | | | KernelScale: 0.00887 |
| | | | | | | | Epsilon: 3917.2 |
| 214 | Accept | 9.3912 | 0.0468 | 8.8186 | 161 | tree | MinLeafSize: 2438 |
| 215 | Accept | 12.36 | 0.56796 | 8.8186 | 161 | svm | BoxConstraint: 577.35 |
| | | | | | | | KernelScale: 30.71 |
| | | | | | | | Epsilon: 1.0514 |
| 216 | Accept | 9.1224 | 1.7567 | 8.8186 | 161 | ensemble | Method: LSBoost |
| | | | | | | | NumLearningCycles: 249 |
| | | | | | | | MinLeafSize: 44 |
| 217 | Accept | 9.0025 | 3.6564 | 8.8186 | 643 | ensemble | Method: LSBoost |
| | | | | | | | NumLearningCycles: 249 |
| | | | | | | | MinLeafSize: 44 |
| 218 | Accept | 9.3834 | 1.1499 | 8.8186 | 161 | ensemble | Method: Bag |
| | | | | | | | NumLearningCycles: 228 |
| | | | | | | | MinLeafSize: 102 |
| 219 | Accept | 9.028 | 2.0525 | 8.8186 | 161 | ensemble | Method: LSBoost |
| | | | | | | | NumLearningCycles: 253 |
| | | | | | | | MinLeafSize: 2 |
| 220 | Accept | 9.3824 | 0.060217 | 8.8186 | 161 | tree | MinLeafSize: 374 |
|=============================================================================================================================================|
| Iter | Eval | log(1+valLoss)| Time for training | Observed min | Training set | Learner | Hyperparameter: Value |
| | result | | & validation (sec)| validation loss | size | | |
|=============================================================================================================================================|
| 221 | Accept | 9.3911 | 0.085777 | 8.8186 | 161 | svm | BoxConstraint: 12.507 |
| | | | | | | | KernelScale: 0.012484 |
| | | | | | | | Epsilon: 227.96 |
| 222 | Accept | 8.9964 | 3.5015 | 8.8186 | 643 | ensemble | Method: LSBoost |
| | | | | | | | NumLearningCycles: 253 |
| | | | | | | | MinLeafSize: 2 |
| 223 | Accept | 9.1692 | 0.06141 | 8.8186 | 161 | tree | MinLeafSize: 9 |
| 224 | Accept | 54.023 | 0.53103 | 8.8186 | 161 | svm | BoxConstraint: 402.26 |
| | | | | | | | KernelScale: 23.129 |
| | | | | | | | Epsilon: 0.15314 |
| 225 | Accept | 9.3834 | 0.061383 | 8.8186 | 161 | tree | MinLeafSize: 1 |
| 226 | Accept | 8.9297 | 0.050965 | 8.8186 | 161 | tree | MinLeafSize: 30 |
| 227 | Accept | 8.9426 | 0.069941 | 8.8186 | 643 | tree | MinLeafSize: 30 |
| 228 | Accept | 9.3909 | 1.2347 | 8.8186 | 161 | ensemble | Method: Bag |
| | | | | | | | NumLearningCycles: 242 |
| | | | | | | | MinLeafSize: 193 |
| 229 | Accept | 14.093 | 0.51359 | 8.8186 | 161 | svm | BoxConstraint: 2.7008 |
| | | | | | | | KernelScale: 8.988 |
| | | | | | | | Epsilon: 0.31364 |
| 230 | Accept | 8.9475 | 1.8933 | 8.8186 | 161 | ensemble | Method: Bag |
| | | | | | | | NumLearningCycles: 274 |
| | | | | | | | MinLeafSize: 2 |
| 231 | Accept | 9.3847 | 0.060031 | 8.8186 | 161 | tree | MinLeafSize: 5326 |
| 232 | Accept | 8.8871 | 2.3958 | 8.8186 | 643 | ensemble | Method: Bag |
| | | | | | | | NumLearningCycles: 274 |
| | | | | | | | MinLeafSize: 2 |
| 233 | Accept | 8.8526 | 3.8394 | 8.8186 | 2569 | ensemble | Method: Bag |
| | | | | | | | NumLearningCycles: 274 |
| | | | | | | | MinLeafSize: 2 |
| 234 | Accept | 9.6167 | 0.71275 | 8.8186 | 161 | svm | BoxConstraint: 0.0033201 |
| | | | | | | | KernelScale: 11.038 |
| | | | | | | | Epsilon: 6.2594 |
| 235 | Accept | 9.3917 | 0.056137 | 8.8186 | 161 | tree | MinLeafSize: 114 |
| 236 | Accept | 45.36 | 4.8199 | 8.8186 | 161 | svm | BoxConstraint: 947.1 |
| | | | | | | | KernelScale: 0.01755 |
| | | | | | | | Epsilon: 38.99 |
| 237 | Accept | 32.375 | 0.43733 | 8.8186 | 161 | svm | BoxConstraint: 80.29 |
| | | | | | | | KernelScale: 131.32 |
| | | | | | | | Epsilon: 1.4516 |
| 238 | Accept | 9.1149 | 0.072948 | 8.8186 | 643 | tree | MinLeafSize: 9 |
| 239 | Accept | 9.3992 | 0.058396 | 8.8186 | 161 | svm | BoxConstraint: 0.0087101 |
| | | | | | | | KernelScale: 0.049442 |
| | | | | | | | Epsilon: 3014.3 |
| 240 | Accept | 32.828 | 0.68213 | 8.8186 | 161 | svm | BoxConstraint: 0.01464 |
| | | | | | | | KernelScale: 30.001 |
| | | | | | | | Epsilon: 34.092 |
|=============================================================================================================================================|
| Iter | Eval | log(1+valLoss)| Time for training | Observed min | Training set | Learner | Hyperparameter: Value |
| | result | | & validation (sec)| validation loss | size | | |
|=============================================================================================================================================|
| 241 | Accept | 76.162 | 5.2571 | 8.8186 | 161 | svm | BoxConstraint: 25.679 |
| | | | | | | | KernelScale: 0.058947 |
| | | | | | | | Epsilon: 5.5863 |
| 242 | Accept | 9.0454 | 2.2506 | 8.8186 | 161 | ensemble | Method: LSBoost |
| | | | | | | | NumLearningCycles: 275 |
| | | | | | | | MinLeafSize: 2 |
| 243 | Accept | 9.0188 | 4.1799 | 8.8186 | 643 | ensemble | Method: LSBoost |
| | | | | | | | NumLearningCycles: 275 |
| | | | | | | | MinLeafSize: 2 |
| 244 | Accept | 9.3987 | 0.071851 | 8.8186 | 161 | svm | BoxConstraint: 345.64 |
| | | | | | | | KernelScale: 0.90102 |
| | | | | | | | Epsilon: 370.38 |
| 245 | Accept | 49.943 | 0.60096 | 8.8186 | 161 | svm | BoxConstraint: 391.91 |
| | | | | | | | KernelScale: 3.856 |
| | | | | | | | Epsilon: 12.255 |
| 246 | Accept | 9.4879 | 0.084173 | 8.8186 | 161 | tree | MinLeafSize: 2 |
| 247 | Accept | 9.3865 | 1.404 | 8.8186 | 161 | ensemble | Method: Bag |
| | | | | | | | NumLearningCycles: 263 |
| | | | | | | | MinLeafSize: 255 |
| 248 | Accept | 9.3816 | 1.6134 | 8.8186 | 643 | ensemble | Method: LSBoost |
| | | | | | | | NumLearningCycles: 286 |
| | | | | | | | MinLeafSize: 584 |
| 249 | Accept | 45.435 | 0.10098 | 8.8186 | 161 | svm | BoxConstraint: 0.005269 |
| | | | | | | | KernelScale: 0.0040109 |
| | | | | | | | Epsilon: 86.961 |
| 250 | Accept | 9.3853 | 1.4575 | 8.8186 | 161 | ensemble | Method: Bag |
| | | | | | | | NumLearningCycles: 280 |
| | | | | | | | MinLeafSize: 290 |
| 251 | Accept | 9.6044 | 0.69076 | 8.8186 | 161 | svm | BoxConstraint: 291.8 |
| | | | | | | | KernelScale: 755.95 |
| | | | | | | | Epsilon: 1.3387 |
| 252 | Accept | 9.1305 | 2.1799 | 8.8186 | 161 | ensemble | Method: Bag |
| | | | | | | | NumLearningCycles: 296 |
| | | | | | | | MinLeafSize: 7 |
| 253 | Accept | 8.8709 | 2.5698 | 8.8186 | 643 | ensemble | Method: Bag |
| | | | | | | | NumLearningCycles: 296 |
| | | | | | | | MinLeafSize: 7 |
| 254 | Accept | 8.8373 | 3.8823 | 8.8186 | 2569 | ensemble | Method: Bag |
| | | | | | | | NumLearningCycles: 296 |
| | | | | | | | MinLeafSize: 7 |
| 255 | Accept | 8.8187 | 6.4895 | 8.8186 | 10276 | ensemble | Method: Bag |
| | | | | | | | NumLearningCycles: 296 |
| | | | | | | | MinLeafSize: 7 |__________________________________________________________
Optimization completed.
Total iterations: 255
Total elapsed time: 348.5896 seconds
Total time for training and validation: 307.7084 secondsBest observed learner is an ensemble model with:
Learner: ensemble
Method: Bag
NumLearningCycles: 208
MinLeafSize: 16
Observed log(1 + valLoss): 8.8186
Time for training and validation: 4.6234 secondsDocumentation for fitrauto display
Mdl =
CompactRegressionEnsemble
PredictorNames: {1×30 cell}
ResponseName: ‘metastatic_diagnosis_period’
CategoricalPredictors: [1 2]
ResponseTransform: ‘none’
NumTrained: 208Properties, Methods
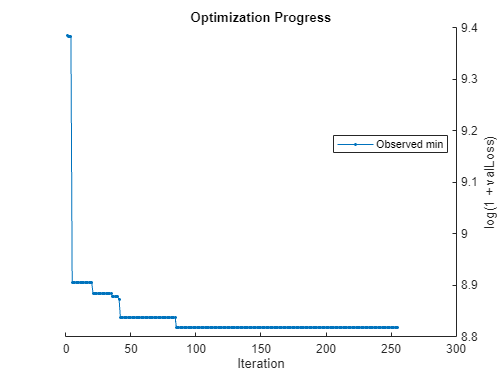
Now I have a trained Compact Regression Ensemble model! If you wanted to explore machine learning options interactively, check out the documentation and video for the Regression Learner app, which allows you to rapidly prototype, modify, and explore regression models.

Create Submission

Once you have a model that performs well, it’s time to create a submission for the datathon! As a reminder, you will upload this file to Kaggle to be scored on the leaderboard.
First, import the challenge test dataset:
testDataFilename = ‘test.csv’;
allTestData = readtable(fullfile(dataFolder, testDataFilename))
Warning: Column headers from the file were modified to make them valid MATLAB identifiers before creating variable names for the table. The original column headers are saved in the VariableDescriptions property.
Set ‘VariableNamingRule’ to ‘preserve’ to use the original column headers as table variable names.
allTestData = 5646×151 table
patient_id patient_race payer_type patient_state patient_zip3 Region Division patient_age patient_gender bmi breast_cancer_diagnosis_code breast_cancer_diagnosis_desc metastatic_cancer_diagnosis_code metastatic_first_novel_treatment metastatic_first_novel_treatment_type population density age_median age_under_10 age_10_to_19 age_20s age_30s age_40s age_50s age_60s age_70s age_over_80 male female married
1 730681 ‘COMMERCIAL’ ‘LA’ 713 ‘South’ ‘West South Central’ 55 ‘F’ NaN ‘1746’ ‘Malignant neoplasm of axillary tail of female breast’ ‘C7981’ NaN NaN 4.6391e+03 72.6643 41.5000 11.3952 13.4357 11.4214 11.4452 12.5619 13.0786 14.2571 7.7071 4.7286 50.0191 49.9809 42.3738
2 334212 ‘Black’ ‘NC’ 283 ‘South’ ‘South Atlantic’ 60 ‘F’ 40 ‘C50912’ ‘Malignant neoplasm of unspecified site of left female breast’ ‘C773’ NaN NaN 1.0875e+04 217.9104 39.6447 11.2329 13.7158 15.0053 12.0158 11.5803 11.7711 12.7684 8.5184 3.4066 51.3263 48.6737 44.1355
3 571362 ‘COMMERCIAL’ ‘TX’ 794 ‘South’ ‘West South Central’ 54 ‘F’ 32.3300 ‘1742’ ‘Malignant neoplasm of upper-inner quadrant of female breast’ ‘C773’ NaN NaN 1.8717e+04 1.0195e+03 30.3714 11 18.8643 23.1143 12.2429 9.8786 9.1214 8.3786 4.7786 2.6214 50.2857 49.7143 35.9857
4 907331 ‘COMMERCIAL’ ‘TN’ 373 ‘South’ ‘East South Central’ 63 ‘F’ 27.0700 ‘1748’ ‘Malignant neoplasm of other specified sites of female breast’ ‘C7951’ NaN NaN 7.8048e+03 140.0545 44.3158 10.1947 12.6645 11.7026 10.5250 12.1329 14.9132 13.6816 9.8263 4.3632 49.4066 50.5934 52.2210
5 208382 ‘Asian’ ‘WA’ 980 ‘West’ ‘Pacific’ 62 ‘F’ NaN ‘C50411’ ‘Malig neoplm of upper-outer quadrant of right female breast’ ‘C787’ NaN NaN 2.8628e+04 1.0918e+03 39.6793 12.1434 12.4623 11.3208 15.2132 14.4491 14.1057 11.2264 5.8415 3.2302 49.9698 50.0302 57.0962
6 852863 ‘White’ ‘MEDICARE ADVANTAGE’ ‘CA’ 914 ‘West’ ‘Pacific’ 82 ‘F’ NaN ‘1749’ ‘Malignant neoplasm of breast (female), unspecified’ ‘C7951’ NaN NaN 3.9505e+04 4.0085e+03 37.5500 11.4875 11.4375 14.5125 16.6125 14.2875 13.6500 9.4750 5.3500 3.2250 49.6500 50.3500 43.3875
7 494644 ‘Asian’ ‘MI’ 483 ‘Midwest’ ‘East North Central’ 67 ‘F’ 21.8000 ‘C50911’ ‘Malignant neoplasm of unsp site of right female breast’ ‘C773’ NaN NaN 2.0151e+04 724.9353 42.0784 11.0392 13.0098 11.6431 11.8882 13.0647 15.1098 12.8686 7.4000 3.9588 49.2922 50.7078 54.0137
8 852015 ‘White’ ‘MEDICAID’ ‘FL’ 336 ‘South’ ‘South Atlantic’ 51 ‘F’ NaN ‘C50919’ ‘Malignant neoplasm of unsp site of unspecified female breast’ ‘C7931’ NaN NaN 3.0205e+04 1.5172e+03 35.6296 11.6963 14.2296 16.5926 15.2518 12.9037 11.6296 9.5259 5.4667 2.7444 49.6963 50.3037 39.3148
9 521061 ‘Black’ ‘MEDICAID’ ‘CA’ 917 ‘West’ ‘Pacific’ 44 ‘F’ NaN ‘C50011’ ‘Malignant neoplasm of nipple and areola, right female breast’ ‘C779’ NaN NaN 4.3030e+04 2.0486e+03 38.8522 11.3065 12.8978 14.1217 13.5326 13.1609 13.3783 11.4739 6.3804 3.7370 49.0522 50.9478 48.5044
10 907023 ‘White’ ‘PA’ 160 ‘Northeast’ ‘Middle Atlantic’ 70 ‘F’ NaN ‘C50812’ ‘Malignant neoplasm of ovrlp sites of left female breast’ ‘C7951’ NaN NaN 5.8126e+03 130.5714 44.6743 10.2943 12.1914 10.6971 11.6086 12.4543 14.5114 15.5171 8.0343 4.6629 50.5486 49.4514 56.5857
11 906063 ‘COMMERCIAL’ ‘TX’ 774 ‘South’ ‘West South Central’ 27 ‘F’ 27.3700 ‘C50912’ ‘Malignant neoplasm of unspecified site of left female breast’ ‘C773’ NaN NaN 1.9403e+04 270.8549 39.1349 12.5188 15.7422 12.6547 13.3703 10.0297 12.6359 10.6875 7.1516 5.1937 50.0281 49.9719 51.7047
12 558053 ‘Hispanic’ ‘MEDICAID’ ‘DE’ 199 ‘South’ ‘South Atlantic’ 44 ‘F’ 33.2000 ‘C50112’ ‘Malignant neoplasm of central portion of left female breast’ ‘C773’ NaN NaN 1.0754e+04 180.9974 45.9846 10.3359 11.5462 11.4692 10.6795 9.9436 14.4461 15.7180 10.7692 5.0949 50.7026 49.2974 50.9436
13 832804 ‘White’ ‘MEDICARE ADVANTAGE’ ‘OH’ 442 ‘Midwest’ ‘East North Central’ 82 ‘F’ NaN ‘19881’ ‘Secondary malignant neoplasm of breast’ ‘C7951’ NaN NaN 13035 355.7023 42.8907 10.5953 14.0861 11.4395 11.4233 11.4302 14.9023 13.5488 8.5814 4.0023 49.9279 50.0721 54.1256
14 554976 ‘COMMERCIAL’ ‘MT’ 591 ‘West’ ‘Mountain’ 71 ‘F’ 23.4800 ‘1749’ ‘Malignant neoplasm of breast (female), unspecified’ ‘C773’ NaN NaN 35549 367.6250 38.3250 13.0250 13.3000 12 14 12.6500 11.5500 12.5750 6.7500 4.1500 49.6000 50.4000 51.4750
Then we need to process this dataset in the same way that we did the training data. In this section, I use code instead of the live tasks for simplicity.
% replace cell arrays with categoricals
varTypes = varfun(@class, allTestData, OutputFormat=“cell”);
catIdx = strcmp(varTypes, “cell”);
varNames = allTestData.Properties.VariableNames;
catVarNames = varNames(catIdx);
for catNameIdx = 1:length(catVarNames)
allTestData.(catVarNames{catNameIdx}) = categorical(allTestData.(catVarNames{catNameIdx}));
end
% remove variables with too many missing data points
allTestData = removevars(allTestData, [“patient_race”, “bmi”, “metastatic_first_novel_treatment”, “metastatic_first_novel_treatment_type”]);
% add ‘yearsFromMeanAge’ variable
meanAge = mean(allTestData.patient_age);
yearsFromMeanAge = allTestData.patient_age – meanAge;
allTestData = addvars(allTestData, yearsFromMeanAge);
We also need to use the transform function to create the same features as we created using genrfeatures for the training data.
augTestData = transform(T, allTestData);
Now that the data is in the format our machine learning model expects it to be in, use the predict function to make predictions, and create a table to contain the patient IDs and corresponding predictions.
submissionPreds = predict(Mdl, augTestData);
submissionTable = table(allTestData.patient_id, submissionPreds, VariableNames=[“patient_id”, “metastatic_diagnosis_period”])
submissionTable = 5646×2 table
patient_id metastatic_diagnosis_period
1 730681 214.2833
2 334212 57.7037
3 571362 223.1813
4 907331 219.9710
5 208382 55.4499
6 852863 216.6935
7 494644 56.6413
8 852863 216.6935
9 521061 68.0861
10 907023 53.8339
11 906063 67.2746
12 558053 67.3586
13 832804 205.2770
14 554976 208.7227
Last, export your predictions to a .CSV file, then upload to Kaggle for scoring.
writetable(submissionTable, “Predictions.csv”);
Thank you for following along with this tutorial, and best of luck to all participants. If you have any questions about this tutorial or MATLAB, reach out to us at studentcompetitions@mathworks.com or by tagging gracewoolson in the forum. Keep your eye out for our upcoming livestream on the MATLAB YouTube channel on April 18th, where we will walk through this tutorial and answer any questions you have along the way!

|
  • print

コメント

コメントを残すには、ここ をクリックして MathWorks アカウントにサインインするか新しい MathWorks アカウントを作成します。